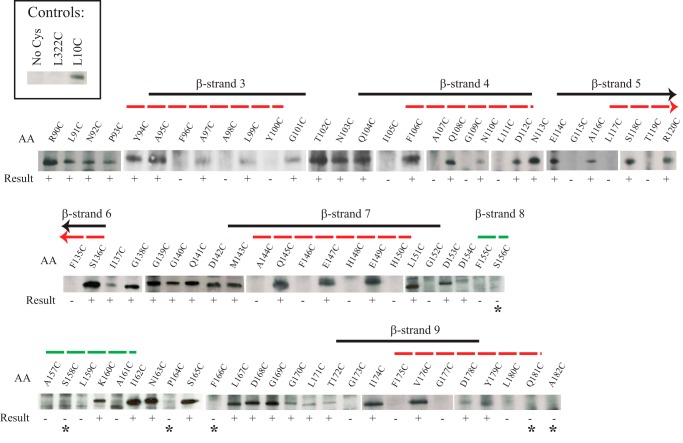
FIGURE 3.
SCAM analysis of different regions of NcTom40. Results and presentation are as described in the legend to Fig. 1. Controls are shown in the upper left box and include L322C as a negative control based on the results in Fig. 1B. β-Strands are as indicated as in Fig. 1. The arrowheads for β-strands 5 and 6 indicate that the strand should extend further in the indicated direction, but no SCAM data were obtained for the region. The labeling result is shown below each position. * indicates positions where labeling was expected, due to the position of a predicted strand or loop, but not observed. The dashed green line indicates the predicted position of β-strand 8 (12) that was not confirmed by experimental results (see text).

