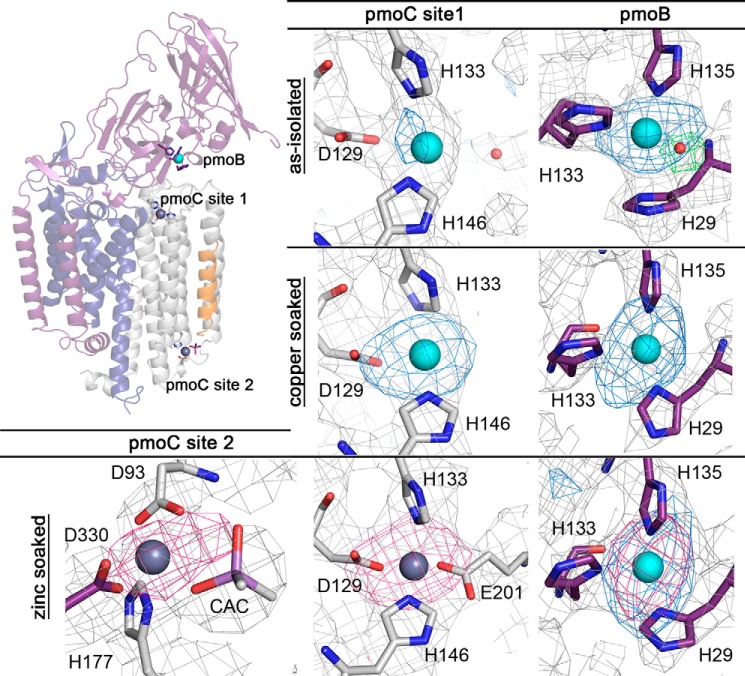
FIGURE 7.
Metal centers of purified Methylocystis sp. str. Rockwell pMMO. The pmoC metal sites for purified as-isolated, copper-soaked, and zinc-soaked crystals (left and center) and the pmoB metal sites for as-isolated, copper-soaked, and zinc-soaked crystals (right) are shown. Ligands from the pmoC and pmoB subunits are shown in gray and purple, respectively. Copper and zinc ions are shown as cyan and dark gray spheres. Simulated annealing composite omit maps are shown in gray and contoured at 1σ. Anomalous difference Fourier maps calculated using data collected at the copper and zinc absorption edges are superimposed in blue and magenta, respectively, and are contoured at 3σ. The Fo − Fc map for the solvent ligand in the upper right panel is superimposed in green and contoured at 3σ.

