
Figure 1.
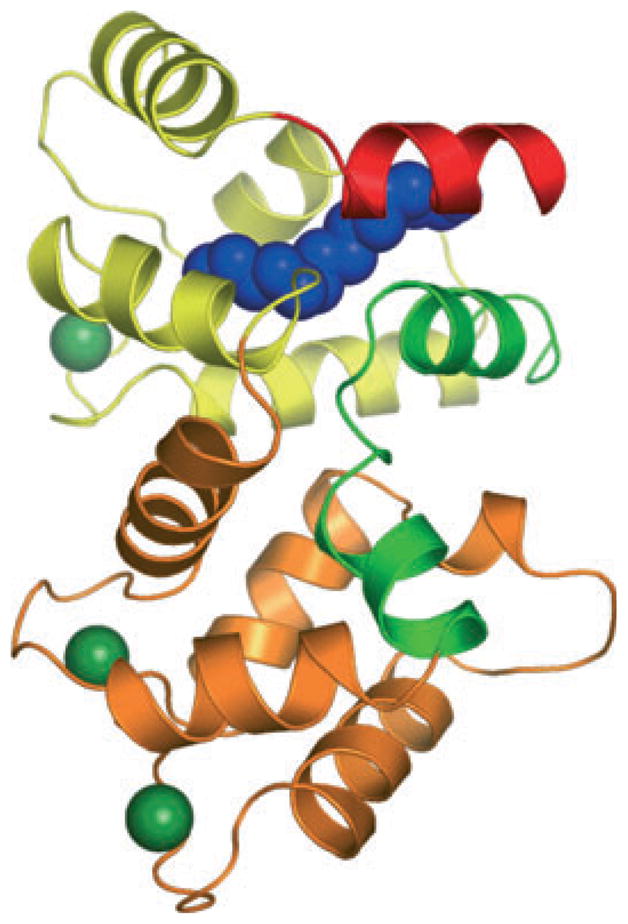
Structure of myristoylated chicken GCAP1 with Ca2+ bound. The cartoon representation is colored yellow for EF-hands 1 and 2 and orange for EF-hands 3 and 4. The N-terminal helix is colored red, the kinked C-terminal helix is green and the myristoyl group is shown as a space-filling model in blue. Bound Ca2+ ions are shown in dark green.