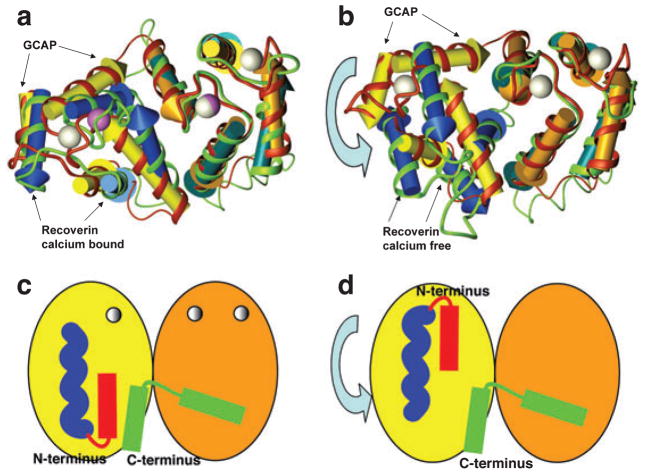
Figure 5.
Model of the Ca2+-induced conformational change in GCAP1. (a) EF-hands of Ca2+-bound GCAP represented by yellow and orange arrowed cylinders, red ribbon and white calcium ions, superimposed on Ca2+-bound recoverin represented by blue and green-blue arrowed cylinders, green ribbon and violet Ca2+ ions. N- and C-terminal parts of the structure were removed for clarity. Superimposition was done on C-terminal EF-hand pairs (orange and green-blue cylinders). (b) EF-hands of Ca2+-bound GCAP superimposed on Ca2+-free recoverin. Superimposition was done on C-terminal EF-hand pairs. Coloring as in (a). (c, d) Schematic representation of a possible Ca2+-induced conformational change in GCAP1 where the N-terminal (red) and C-terminal (green) helices are clustered together in the Ca2+-bound state (c), but separated by domain rotation in the Ca2+-free form (d). The myristoyl group is represented in blue.

