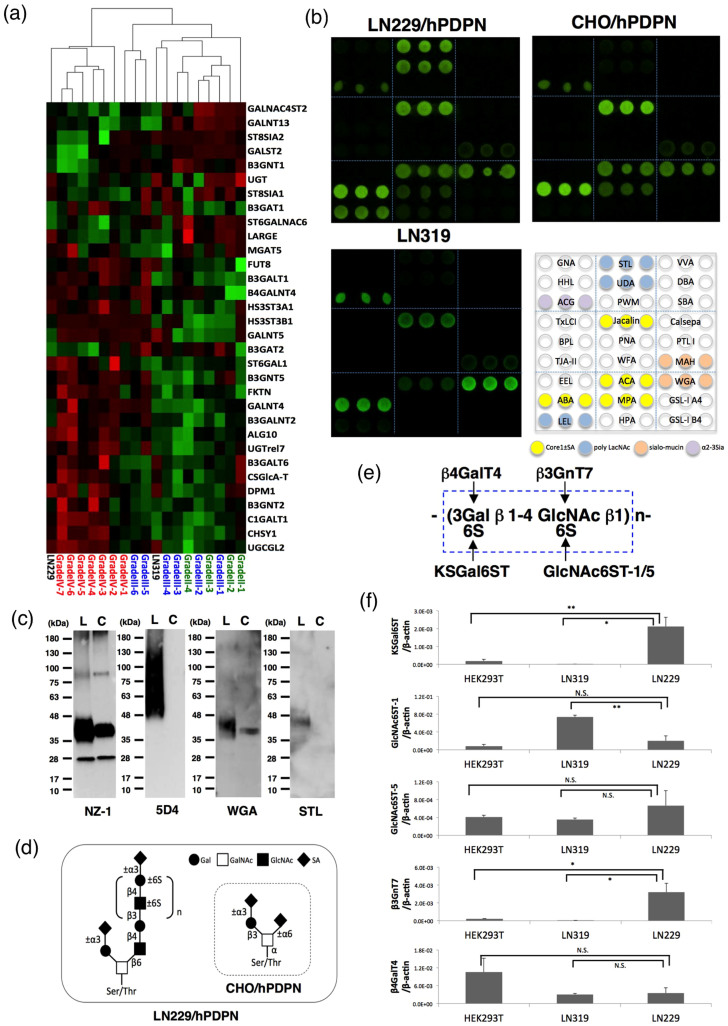
Figure 1. Production of cancer-type podoplanin.
(a) Real-time PCR analyses of glycogenes revealed that LN229 cells were clustered into glioblastoma tissues (WHO Grade IV); by contrast, another glioblastoma cell line, LN319, was clustered into WHO Grade II/III. (b) Lectin microarray. Podoplanins on LN229/hPDPN, LN319, and CHO/hPDPN cells were solubilized using PBST. Then, 100 μl of purified podoplanin was applied to the lectin array. After incubation at 20°C for 17 h, the reaction solution was discarded. The glass slide was scanned using a GlycoStation Reader 1200. (c) Western-blot analyses. Purified podoplanin (0.1 μg) was boiled in SDS sample buffer, electrophoresed, and transferred onto a PVDF membrane. After blocking, the membrane was incubated with primary antibodies (NZ-1, 5D4) or biotinylated lectin (WGA, STL) and then with peroxidase-conjugated secondary antibodies or streptavidin-HRP; the membrane was developed with ECL-plus reagents using a Sayaca-Imager. L, LN229/hPDPN; C, CHO/hPDPN. (d) Schematic illustration of the glycan structure of podoplanin. Podoplanin in LN229/hPDPN cells possesses both polylactosamine and sialylated core 1, whereas podoplanin in CHO/hPDPN cells possesses only sialylated core 1. (e) Structure and synthesis of keratan sulfate. (f) Transcript levels for KSGal6ST, GlcNAc6ST-1, GlcNAc6ST-5, β3GnT7, and β4GalT4 genes in each cell line were measured using real-time PCR. Values normalized to the level of β-actin transcripts are presented. The error bars show the standard deviation of three independent experiments. Statistical analysis was performed using Student's t-test (*p < 0.05, **p < 0.01).

