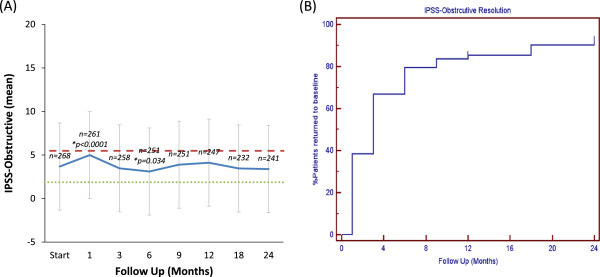
Figure 2.

Obstructive voiding symptoms following SBRT for prostate cancer. (A) Mean IPSS-O score. The graphs show unadjusted changes in average scores over time. IPSS-O scores range from 0–20 with higher values representing worsening obstructive voiding symptoms. The thresholds for clinically significant changes in scores (½ standard deviation above and below the baseline) are marked with dashed lines. Error bars indicate 95% confidence intervals. (B) Time to IPSS-O resolution (return to within one point of the baseline score).
