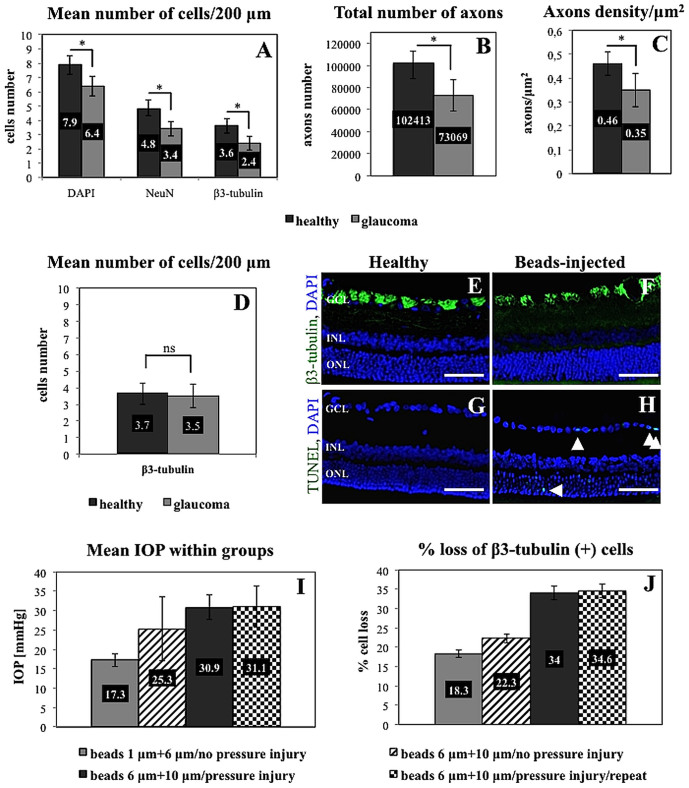
Figure 3.
Mean number of cells in the ganglion cell layer of the retina (A), total number of axons in the optic nerve (B), and optic nerve axon density (C) in healthy and glaucomatous eyes (after 6 weeks; rapid beads injection with initial high-pressure injury). (D) – mean number of cells in the ganglion cell layer of the healthy retina and 7 days after beads injection. Immunostaining revealed no visible difference between beads-injected and healthy retinas for β3-tubulin (E, F), however there was slightly increased number of TUNEL positive cells within ganglion and outer nuclear layer in beads-injected retinas ((G), (H), arrows). The lowest panel shows a comparison between the groups used in the optimization of the model. The combination of bead sizes as well as the use of an initial “pressure injury” resulted in higher mean IOP values (I) and in an efficient and reproducible level of retinal ganglion cell loss (J). The asterisk indicates statistical significance, ns – not significance. Scale bar = = 100 μm. GCL, ganglion cell layer; INL, inner nuclear layer; ONL, outer nuclear layer.

