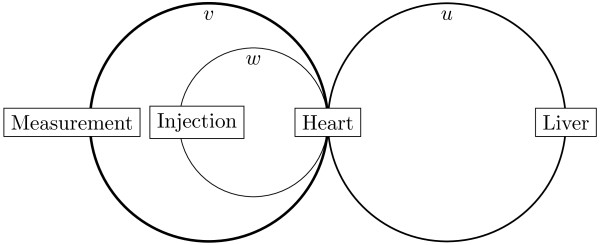
Figure 1.

Schematic view of 3-loop blood flow model. Blood flow is divided into 3 circulatory loops, with the concentration in each loop varying in both space (length along the loop) and time. The variables u(t,x), v(t,x), and w(t,x) represent the concentrations of ICG in Loops 1, 2, and 3, as described in the text. In each loop, the spatial variable (x) runs from 0 to 2π, where x = 0 begins in the center (the heart region), x = π is at the opposite end of the circle (eg, where the liver, injection, and measurement sites are illustrated), and x = 2π is back in the center region. ICG, indocyanine green.
