
Figure 1. AngII-induced AAA formation in hyperlipidemic ApoE-/-/βarr2+/+ and ApoE-/-/βarr2-/- mice and normolipidemic C57BL/6 βarr2+/+ and βarr2-/- mice.
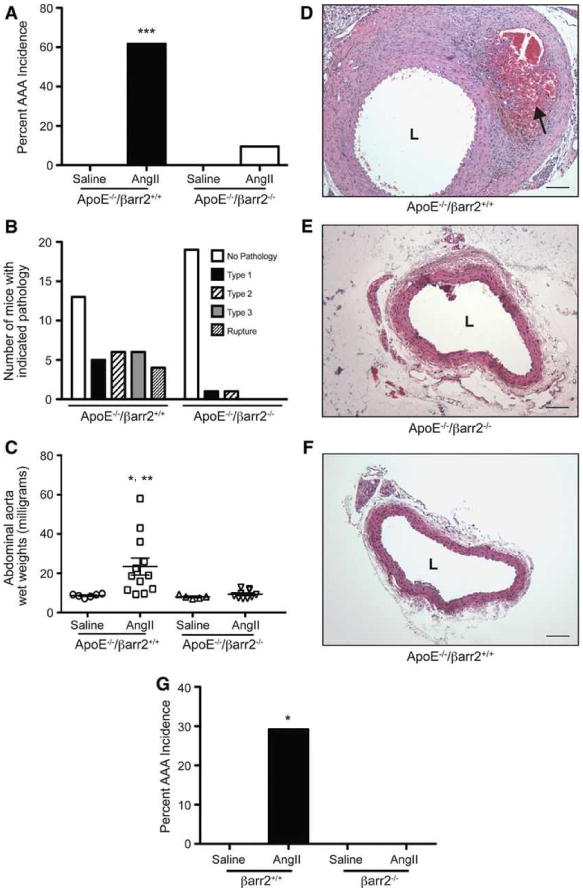
A) Percentage of AAA incidence following 28 days of AngII infusion in ApoE-/-/βarr2+/+ and ApoE-/-/βarr2-/- mice. ***, significantly different from saline treated ApoE-/-/βarr2+/+ mice and AngII-treated ApoE-/-/βarr2-/- mice, P<0.001, N ≥10 per group. B) AAAs in ApoE-/-/βarr2+/+ and ApoE-/-/βarr2-/- mice were scored from Type 1 to Type 4 pathology, based on the external diameter using a classification scheme similar to the one described previously18 C) AAA severity in in ApoE-/-/βarr2+/+ and ApoE-/-/βarr2-/- mice as determined by abdominal aorta wet weights. Each symbol represents an individual animal. *, significantly different from saline-treated ApoE-/-/βarr2+/+ mice, P<0.05. **, significantly different from AngII-treated ApoE-/-/βarr2-/- mice, P<0.01, N ≥5 per group. Representative images of H&E-stained aortic sections from D) AngII-treated ApoE-/-/βarr2+/+ mice E) AngII-treated ApoE-/-/βarr2-/- and F) saline-treated ApoE-/-/βarr2+/+ mice. Arrow indicates thrombus formation. Scale bars, 0.1mm. L, lumen. G) Percentage of AAA incidence in normolipidemic C57BL/6 βarr2+/+ and -βarr2-/- mice following 28 days of AngII infusion. *, significantly different from saline-treated βarr2+/+ mice and AngII-treated βarr2-/- mice, P<0.05, N ≥10 per group.