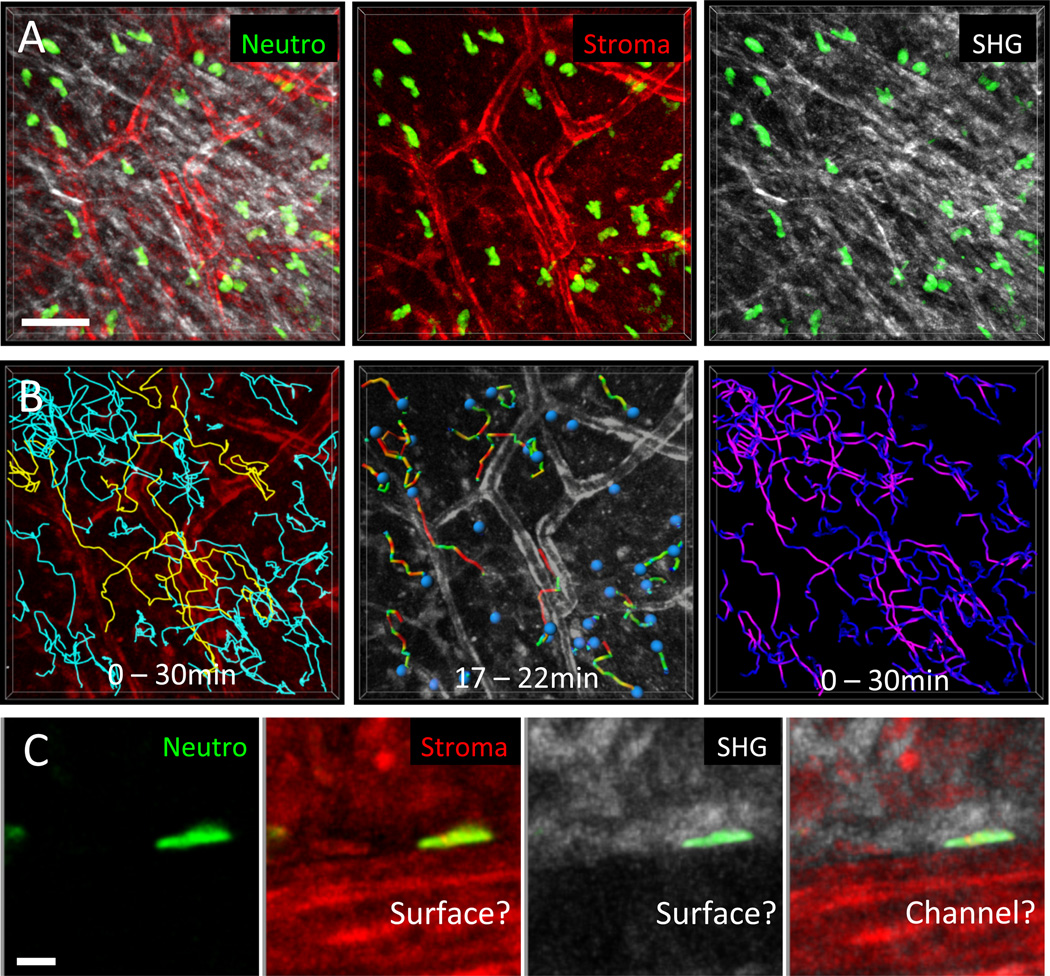
Fig. 5. Correlation of neutrophil migration paths and velocities with connective tissue structure.
(A) 2P-IVM was applied to murine ear skin to visualize the dermis of a transgenic DsRed+/− Lyz2-GFP+/− B6.Albino mouse. Ubiquitously expressed DsRed illuminates all stromal elements (red), GFP-bright cells represent endogenous neutrophils (green), and SHG signals reflect collagen bundles. Neutrophil motility was recorded simultaneously with stromal elements over 30 min. Scale bar = 50 µm. (B) Cell tracking analysis in relation to tissue structures. (Left) Tracks over the entire imaging session were plotted for all cells in the tissue volume and related to the vascular network; 15 % of migrating neutrophils crawled along vessels (yellow tracks), whereas the remaining cells migrated in the interstitial spaces between vessels (blue tracks). (Middle) Dragontails indicate the migration paths covered by individual cells in the last 5 min. The colors of the dragontails indicate instantaneous velocities (red: fast, green: slow). This particular short time frame suggests that neutrophils have high instantaneous velocities preferentially when migrating close to vessels. (Right) In contrast to the 5-min interval analysis, plotting the velocity distributions over the entire imaging session of 30 min (purple: fast, dark blue: slow) revealed that most neutrophils migrated fastest in interstitial spaces with a loose local collagen network. (C) Depending on the graphic representation, neutrophils close to vessels appear to migrate along the vascular surface (middle left) or along a 2D surface of collagen matrix (middle right), which might actually be a channel-like confined space (outer right). Scale bar = 50 µm. Lyz2-GFP mice were a kind gift of Thomas Graf.

