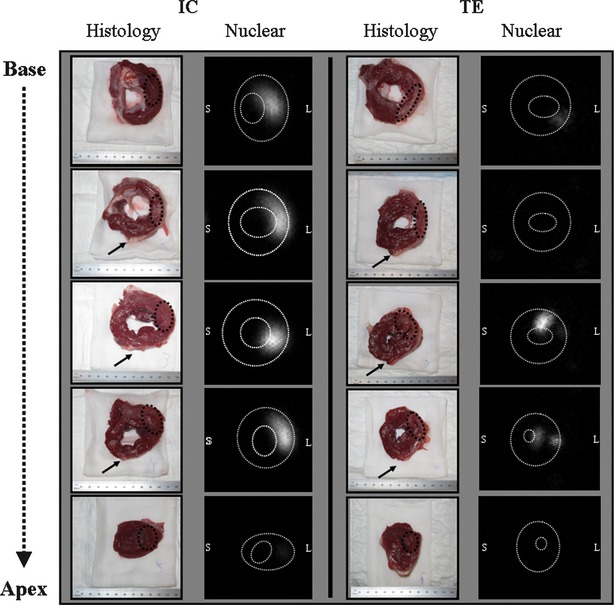
Fig. 3.

Segmental analysis of the LV after percutaneous delivery. To visualize cell retention in the LV, the heart was cut into five slices from apex to base (histological images). Static anterior images were obtained from all slices within 4 hrs after cell delivery. Note that after TE delivery, cells were mainly retained in the midlateral wall whereas IC infusion showed a more scattered distribution of MSC in the posterolateral wall. Representative histological and nuclear images were derived from the same animals for both groups. Black arrow: left anterior descending artery; IC: intracoronary; L: lateral wall; TE: transendocardial; White dotted lines: endocardial and epicardial border; S: septal wall; Black dotted line: area of interest.
