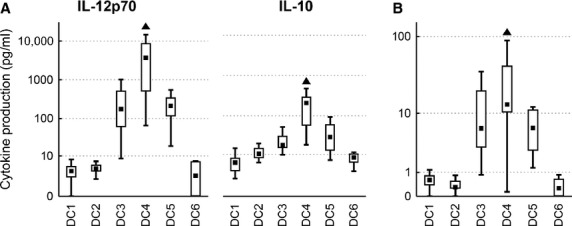
Fig. 2.

DC cytokine profiles. DC were matured with TNF-α (DC1); TNF-α, IL-1α, IL-6, PGE2 (DC2); TNF-α, IL-1β, IFN-γ, PGE2, R848 (DC3); IFN-γ, LPS (DC4); IFN-γ, R848 (DC5) or were cultured without maturation (DC6). Box plots represent (A) production of IL-12p70 and IL-10 after 24 hrs of maturation, and (B) the ratio of IL-12p70/IL-10 production. Data are presented as the median (▪), 25–75% quantiles (box), and non-outlier range (whiskers) of 17 donors. Marker ▲ indicates significant difference from all groups not indicated by this marker, P < 0.05, Wilcoxon matched pair test.
