
Fig. 7.
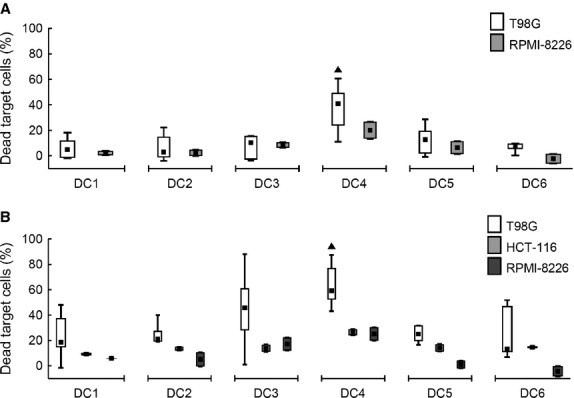
Cytotoxic effect of autologous and allogeneic T cells induced by DC. DC were loaded with a tumour lysate of a T98G tumour cell line and matured with TNF-α (DC1); TNF-α, IL-1α, IL-6, PGE2 (DC2); TNF-α, IL-1β, IFN-γ, PGE2, R848 (DC3); IFN-γ, LPS (DC4); IFN-γ, R848 (DC5) or cultured without maturation (DC6). Autologous or allogeneic T cells, co-cultured with those DC for 6 days, were mixed in a ratio 10:1 with CFSE-labelled fresh tumour cells. Those were target cells T98G, or control cells HCT116 and RPMI-8226 (as indicated in the figure legend). After 24 hrs of co-incubation, dead tumour cells were quantified on a flow cytometer. Results for cytotoxicity induced by (A) autologous and (B) allogeneic T cells are shown. Data are presented as the median (▪), 25–75% quantiles (box), and non-outlier range (whiskers) of at least 6 donors for T98G and two donors for both HCT116 and RPMI-8226 cell lines. Marker ▲ indicates significant difference from all T98G groups not indicated by this marker, P < 0.05, Wilcoxon matched pair test.