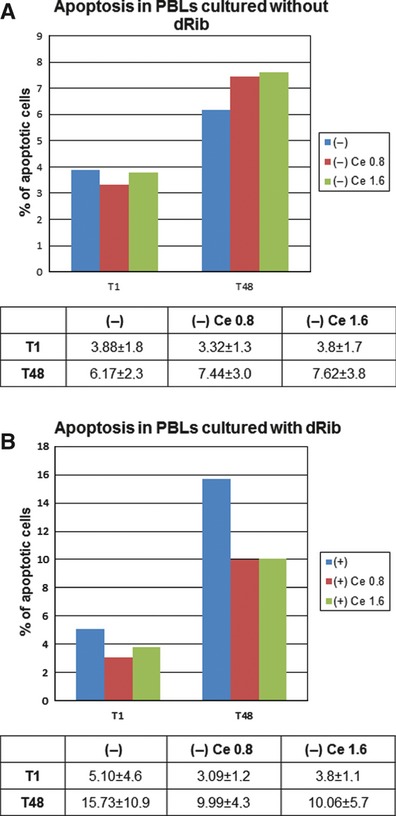
Fig. 1.

(a) Cytofluorimetric analysis of PBLs cultured in standard condition (−) plus 0.8 and 1.6 mg/ml Cere after 1 and 48 hrs of culture. (b) Cytofluorimetric analysis of dRib treated PBLs cultured without Cere (+) and with 0.8 and 1.6 mg/ml Cere after 1 (T1) and 48 (T48) h of culture. Values are expressed as mean percentage ±SD of apoptotic cells.
