
Figure 1. Examination of islets for myeloid cells, T cells and myeloid transcriptional analysis.
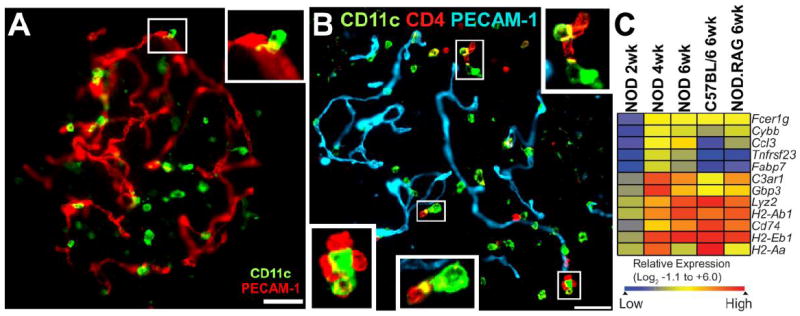
A) Islet of 8 week-old NOD.Rag1-/- mouse showing myeloid cells (CD11c+) and blood vessels (PECAM-1+). Note the close apposition of CD11c+ cells with vessels. Inset shows the apposition between islet myeloid cell and vessel. B) Islet from 6 week-old NOD female mice stained for blood vessels (PECAM-1+), islet myeloid cells (CD11c+), and T cells (CD4+). Insets show contacts between islet myeloid cells and CD4 T cells. White bars represent 50 μm. Panel B) and C) taken from Ref. 12 with permission. C) Microarray identification of myeloid gene signatures in islets of Langerhans. The heat map shows a hierarchically clustered gene subset that is enriched for macrophage/myeloid genes in NOD mice (2, 4 and 6 weeks), C57BL/6 and NOD.Rag-1-/- (6 weeks). Color intensity is based on the row normalized log2 scaled relative expression. The subset of genes represented in Panel C) is derived from the analysis detailed in Ref. 12.