
Figure 1.
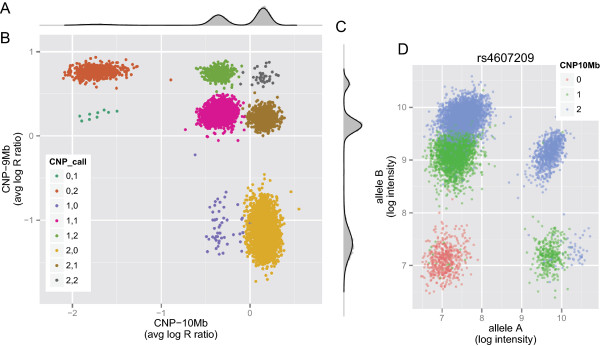
Low-level data and posterior summaries from a Bayesian finite mixture model supporting copy number alterations. (A) A histogram of the average log R ratios at CNP-10Mb (gray). The posterior distribution approximated by the Gibbs sampler is indicated by the black lines overlaying the histogram. (B) The average log R ratios at the CNP-9Mb and CNP-10Mb chromosome 4 loci. (C) Same as (A) for the CNP-9Mb locus. (D) The log-transformed intensities for alleles A and B allele at a SNP in the CNP-10Mb locus. The genotype clusters are consistent with the copy number estimates from the mixture model.