
Figure 4.
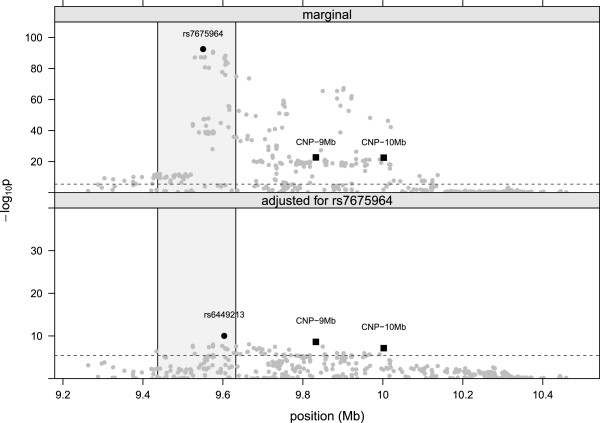
SNP and CNP associations near SLC2A9 with and without adjustment for genome-wide significant SNP rs7675964. Top: Negative log10p-values derived from a likelihood ratio test comparing a null model with clinical and technical covariates to an extended model evaluating the marginal association of SNPs (gray circles) or CNP×gender (black rectangles). The region shaded in light gray is the location of the SLC2A9 gene. Bottom: Negative log10p-values from a likelihood ratio test comparing an extended model with SNPs or CNP × gender to a null model that includes the rs7675964 genotypes.