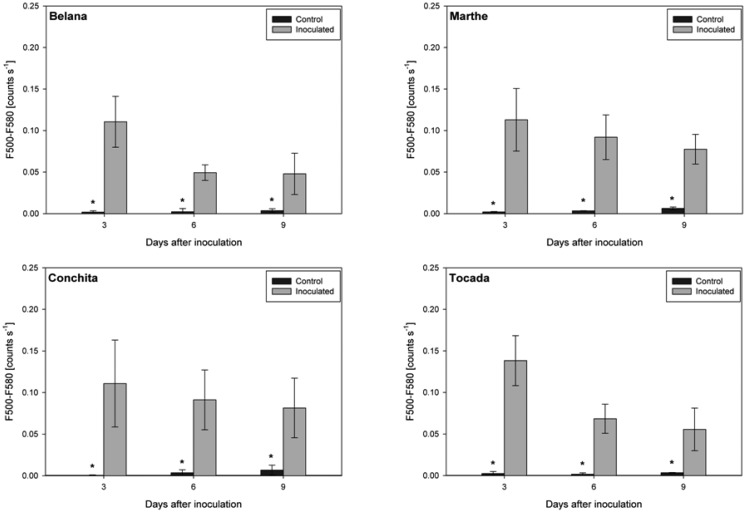
Figure 3.
Green fluorescence intensity (500–580 nm scaled as counts s−1) recorded under blue excitation. Leaves of the healthy control and powdery mildewed plants of the barley varieties Belana, Marthe, Conchita and Tocada were studied at 3, 6, 9 days after inoculation. Values indicate mean ± standard error (n = 5). Asterisk (*) indicate significant differences (t-test, p ≤ 0.05) between control and inoculated leaves for each variety and measuring day.

