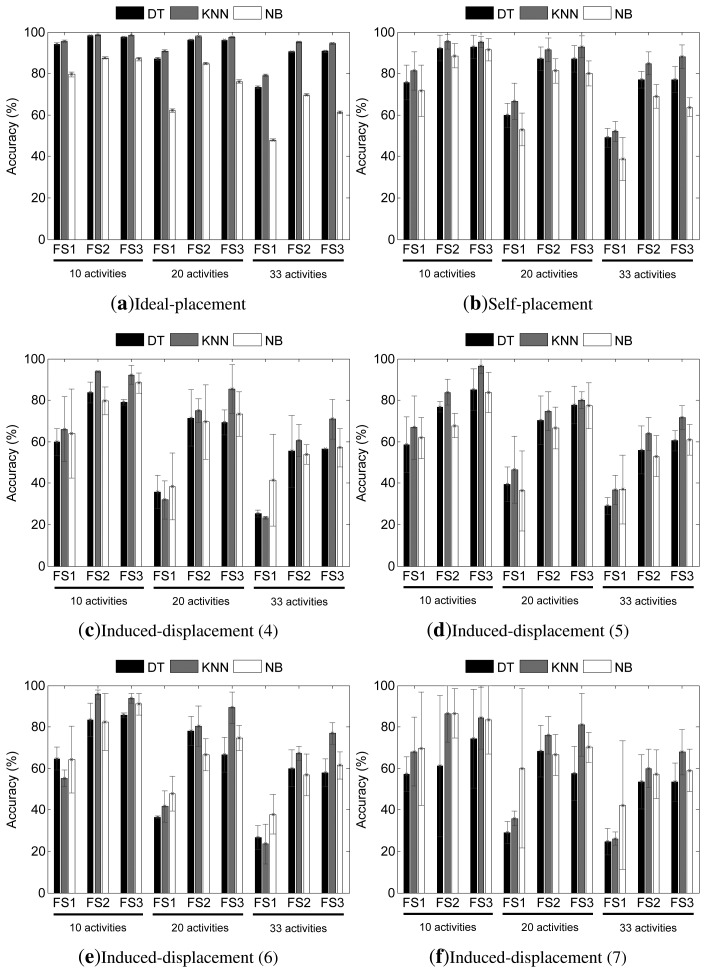
Figure 8.
Accuracy (mean and standard deviation) results from the evaluation of the decision fusion model for the (a) ideal-placement; (b) self-placement and (c–f) induced-displacement (number of sensors) settings. The top legend identifies the base classifiers paradigm. The horizontal axis labels identify the feature set used for each experiment. The activity recognition dataset (i.e., the number of activities) used is respectively underlined.

