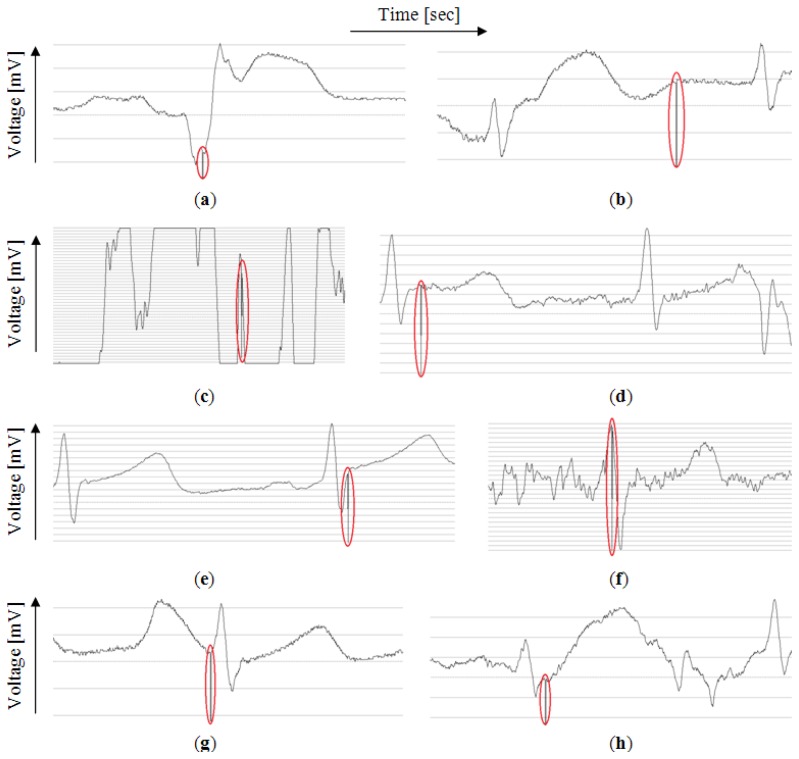
Figure 7.
The anomalies that stopped the simulation. The signals are drawn by the authors' simulation software. (a) One faulty beat; (b) A series of faulty beats; (c) One of the electrodes probably fell off; (d) Anomalies in signal shape; (e) Higher than average T value; (f) Electrical distortion in signal; (g) Higher than average P value; (h) P and T waver merged.

