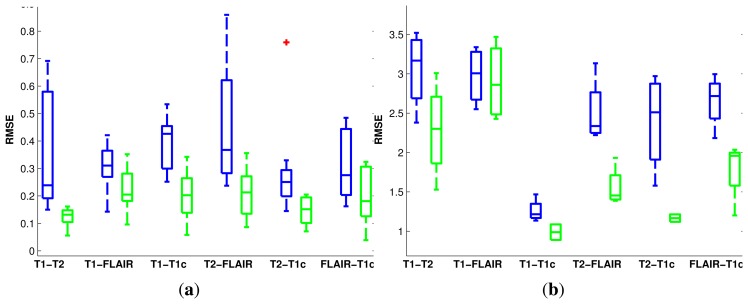
Figure 6.
Boxplots of the root mean squared registration errors (in mm) for the BRATS data sets. For each pair of modalities, left-most (blue) boxplots correspond to using MI, while right-most (green) ones correspond to diffusion distance. Red crosses indicate outliers. (a) Rigid registration; (b) non-rigid registration.

