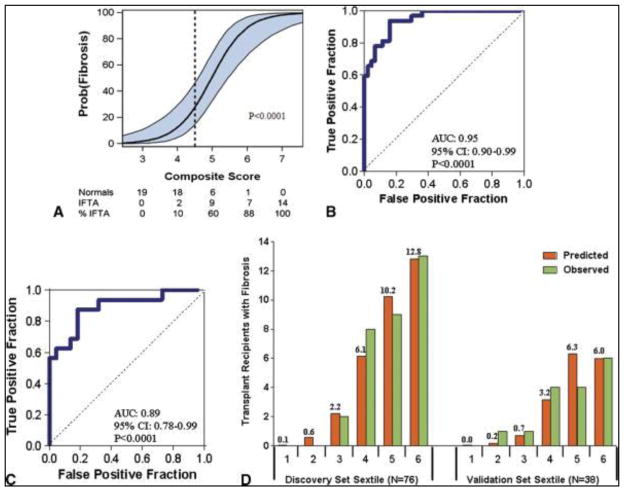
Figure 4. Noninvasive Diagnosis of IF/TA in the Kidney Allograft: Discovery and Validation of Urinary Cell Four-Gene Composite Score.
To predict IF/TA in the Discovery set, we calculated a composite score based on a logistic model, from levels of vimentin mRNA, NKCC2 mRNA and E cadherin mRNA and the 18S rRNA (4-gene signature) in urine samples obtained from the 32 kidney graft recipients with biopsy-confirmed IF/TA and 44 subjects with stable graft function and with normal allograft biopsy results. The composite score of the 4-gene signature predicted IF/TA with high accuracy. Panel A shows the predicted probability of IF/TA (Y-axis) as a logistic function of the composite score of the 4-gene signature (X-axis). The blue band represents the 95% confidence interval of the composite score. Panel B shows the receiver-operating-characteristic curve for the diagnosis of IF/TA using the composite score. The diagnostic model had an area under the curve of 0.95 (95%CI: 0.90 to 0.99, P<0.0001). At a cutpoint or 4.5, IF/TA was diagnosed with a specificity of 84.1% (95%CI: 73.3 to 94.9%) and a sensitivity of 93.8% (95%CI: 85.4 to 99.9%) in the discovery set. We used the final prediction equation derived from the discovery set to calculate the predicted probability of IF/TA in the validation set of 38 kidney transplant recipients; 16 with biopsy-confirmed IF/TA and 22 with stable graft function and normal allograft biopsy results. Panel C shows the receiver-operating characteristic curve of the composite score (derived from the equation used in the discovery set) applied to the validation set for the diagnosis of IF/TA. The area under the curve for the diagnosis of IF/TA in the validation set was 0.89 (95%CI: 0.78 to 0.99, P<0.0001). At the original composite score cutpoint of 4.5 derived from the discovery set, IF/TA was diagnosed in the validation set with a specificity of 77.3% (95%CI: 59.8 to 94.8%) and a sensitivity of 87.5% (95%CI: 71.3 to 99.9%). Panel D shows the predicted and observed number of kidney graft recipients with IF/TA for each sextile of the composite score within the discovery and validation sets. Based on the Hosmer-Lemeshow test, the fit between the observed and the predicted number of subjects with IF/TA in each of the sextiles was excellent (P=0.69) in the discovery set (left half of Fig. 4D). For the validation set (right half of Fig. 4D), the P value was 0.04, suggesting a good fit, given that this set was not involved in the estimation of the model.

