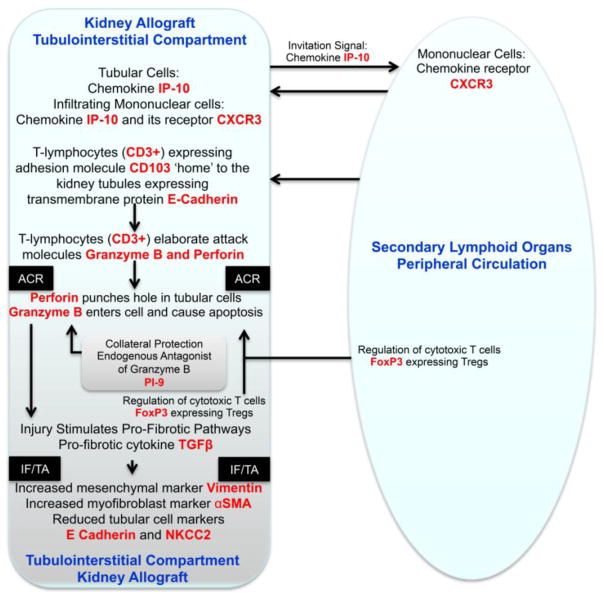
Figure 5. Key Molecular Events During Acute Cellular Rejection of the Kidney Allograft.
The immune repertory contributing to acute cellular rejection involves multiple cell types, cytokines and chemokines and their ligands. T-lymphocytes are the principal effector cells and dendritic cells are the primary antigen presenting cells. In this minimalist model, the chemokine IP-10 and its receptor CXCR3, expressed on T-lymphocytes, facilitate the trafficking of alloreactive T-lymphocytes in to the kidney graft. Intraepithelial homing of the T-lymphocytes is then effected by the physical interaction between CD103 expressed on the T-lymphocytes and E-cadherin displayed on the kidney tubular epithelial cells. The activated/alloreactive T-lymphocytes then employ perforin and granzyme to mediate parenchymal cell damage, which is antagonized in part by the endogenous antagonist proteinase inhibitor-9 (PI-9). Counter-regulatory forces are exerted by FoxP3 expressing regulatory T-lymphocytes (Tregs) and help dampen the anti-allograft response and the ultimate outcome of an episode of acute rejection is determined in part by the balance between the graft destructive cells such as cytotoxic T cells and graft protective Tregs. Although the cells with different functional attributes are depicted here to have distinct pedigrees, transition from one functional type to another (plasticity) is feasible based on the cells versatility and environmental cues. In this T-lymphocyte -centric formulation deterministic of allograft destiny, the antigen-experienced T-lymphocytes provide help to B-lymphocytes and facilitate antibody-mediated rejection. Acute rejection is a precursor of chronic rejection manifested histologically by interstitial fibrosis/tubular atrophy (IF/TA). Acute rejection-associated tissue injury, de-differentiation and repair (epithelial/endothelial-mesenchymal transition) contribute to the pathogenesis of IF/TA and progressive loss of allograft function. The levels of mRNA encoding vimentin, αSMA, E-cadherin and NKCC2 in urinary cells reflect the cellular events associated with IF/TA quantitatively. The mRNAs, colored red in the schematic illustration, have all been detected and quantified using urinary cell mRNA profiling and found to be associated with human kidney allograft status.

