
Figure 4.
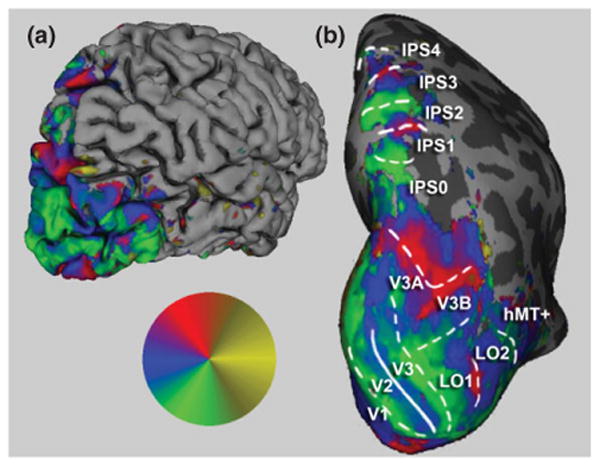
Visuotopically specific activation in posterior cerebral cortex. The angular position of the wedge resulting in the greatest significant (P < 0.05) response is indicated by the colored overlay (inset), with red representing the upper visual meridian, blue the contralateral horizontal meridian, and green the lower meridian. Potential ipsilateral responses are indicated in yellow. The right hemisphere of a single subject is shown. In (a), the reconstructed pial surface is shown from a posterior lateral view. Computational inflation of the folded cortical surface reveals visuotopically specific activation within the sulci (b). Reversals in the represented angular position correspond to areal boundaries in the early visual areas, and are shown as overlaid lines. Dashed lines indicate reversals at representations of the vertical meridian, while solid lines indicate reversals at horizontal meridian representations. On the basis of these scans, we find five hemifield maps along the medial bank of the intraparietal sulcus including areas IPS0 through IPS4.