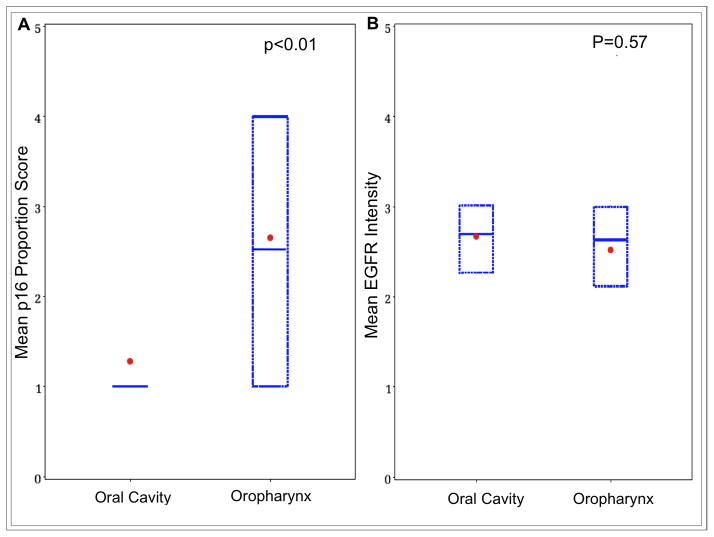
Figure 1.
Comparison of mean score of immunostain across subsites. (a) Box plot shows a significantly lower mean score of p16 proportion in OCSCC versus OPSCC. (b) A similar mean score of EGFR intensity is seen between OCSCC and OPSCC. Dot, mean; box, 25th to 75th percentile; horizontal bar, median.

