
Extended Data Figure 4. Tus/Ter-induced HR in Brca1fl/BRCT 6xTer/HR cells conforms to an affinity/avidity model.
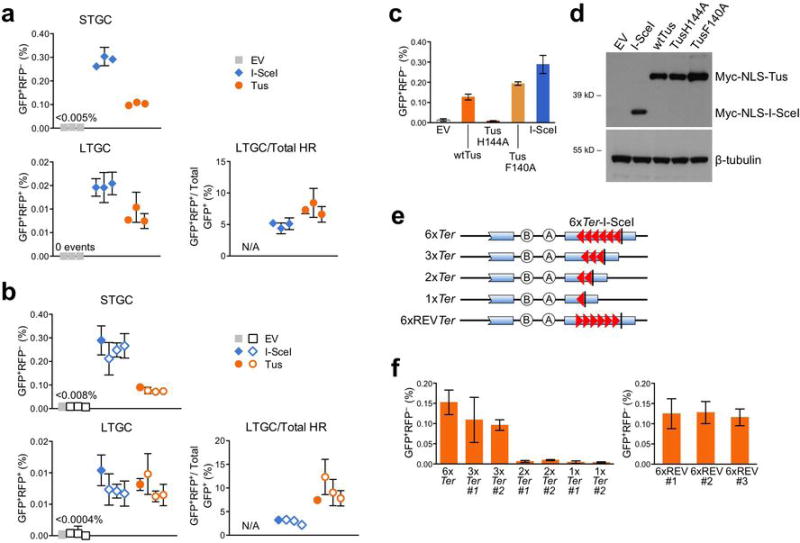
a, Primary data from Fig. 2c, showing directly measured frequencies of background HR, Tus-induced HR and I-SceI-induced HR in three independent Brca1fl/BRCT 6xTer/HR reporter clones. Cells were transfected with empty vector (EV; grey squares), myc-NLS-I-SceI (I-SceI; blue diamonds), or myc-NLS-Tus expression vectors (Tus; orange circles). Each point represents the mean of triplicate samples from three independent experiments (i.e., n=3). Error bars: s.e.m. t-test of Tus vs. EV: STGC P< 0.0001; LTGC P< 0.0001. t-test of I-SceI vs. EV: STGC P< 0.0001; LTGC P< 0.0001. t-test of Tus vs. I-SceI: STGC P <0.0001; LTGC P= 0.0018 ; LTGC/Total HR P=0.0186. b, Primary data comparing a single ROSA26 targeted Brca1fl/BRCT 6xTer/HR clone with three independently derived clones, each harboring a single intact 6xTer/HR reporter randomly integrated at an unknown locus. Filled symbols: ROSA26-targeted clone (as in panel a). Open symbols: data from randomly integrated 6xTer/HR reporter clones. Each point represents the mean of six independent experiments, triplicate replicates for each experiment (i.e., n=6). Error bars: s.e.m. t-test of pooled random integrants Tus vs. EV: STGC P< 0.0001; LTGC P< 0.0001. t-test of pooled random integrants I-SceI vs. EV: STGC P< 0.0001; LTGC P< 0.0001. t-test of pooled random integrants Tus vs. I-SceI: STGC P< 0.0001; LTGC P= 0.3620; LTGC/Total HR P= 0.00012. c, Primary data of STGC products observed in Brca1fl/BRCT 6xTer/HR cells transfected with empty vector (EV), wtTus, DNA binding defective TusH144A, lock defective TusF140A, or I-SceI. All expression vectors are codon-optimized for mammalian expression and encode N-terminal myc epitope and NLS sequences. Each column represents the mean of six independent experiments (i.e., n=6). Error bars: s.e.m. t-test of wtTus vs. EV: P= 0.0002; wtTus vs. TusH144A: P= 0.0004; wtTus vs. TusF140A: P= 0.0042; wtTus vs. I-SceI: P= 0.0139; TusH144A vs. EV: P= 0.4406; TusF140A vs. EV: P< 0.0001; TusF140A vs. TusH144A: P< 0.0001; TusF140A vs. I-SceI: P= 0.0888. d, Myc-tagged protein abundance in transfected Brca1fl/BRCT 6xTer-HR cells: EV: empty vector. Other lanes as marked. Lower panel: beta-tubulin loading control. (Source Data 4) e, Cartoons of the Ter/HR reporter constructs assayed in panel (f). f, Frequencies of Tus-induced STGC in Brca1fl/BRCT cells carrying single copy, ROSA26-targeted Ter/HR reporters shown in panel (e). Left: HR in 6xTer, 3xTer, 2xTer and 1xTer HR reporters, as shown. Right: HR in three independently derived clones carrying single copy, ROSA26-targeted 6xREVTer HR reporters. Each column represents the mean of three independent experiments (i.e., n=3). Error bars: s.e.m. t-test of 6xTer vs. 3xTer#1: P= 0.2604; 6xTer vs. 3xTer#2: P= 0.5192; 6xTer vs. 2xTer#1: P= 0.0547; 6xTer vs. 2xTer#2: P= 0.0524; 6xTer vs. 1xTer#1: P= 0.0507; 6xTer vs. 1xTer#2: P= 0.0507; 3xTer#1 vs. 3xTer#2: P= 0.8291; 3xTer#1 vs. 2xTer#1: P= 0.0650; 3xTer#1 vs. 2xTer#2: P= 0.0606; 3xTer#1 vs. 1xTer#1: P= 0.0576; 3xTer#1 vs. 1xTer#2: P= 0.0574; 3xTer#2 vs. 2xTer#1: P= 0.1832; 3xTer#2 vs. 2xTer#2: P= 0.1748; 3xTer#2 vs. 1xTer#1: P= 0.1677; 3xTer#2 vs. 1xTer#2: P= 0.1697.
By one-way ANOVA (Analysis of Variance) test used to compare more than three sets of data, the trend in HR from 6x−1x p=0.0012.