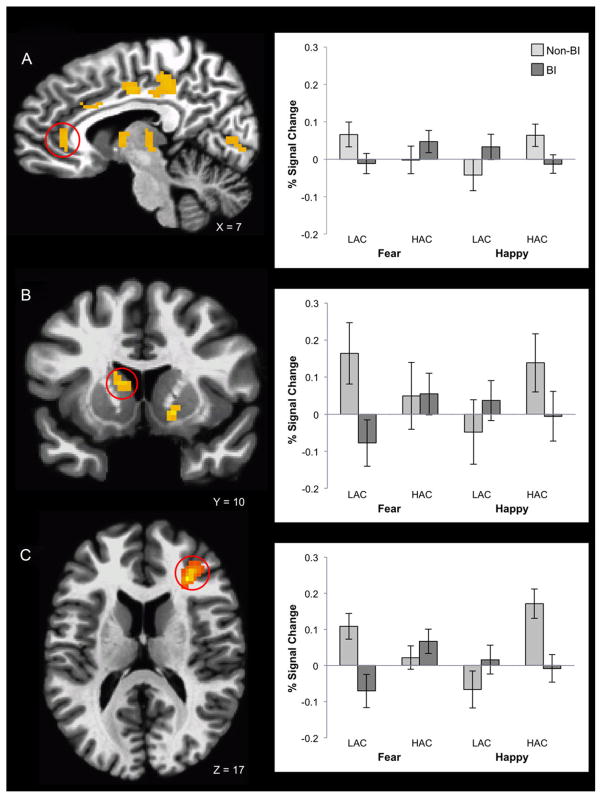
Figure 3.
Group by attention control by emotional valence interaction in the mPFC (A), striatum (B), and dorsolateral dlPFC (C). Bar graphs depict average percent signal-change values extracted from the activation cluster, plotted with standard error bars. BI, behaviorally inhibited; LAC, low attention control; HAC, high attention control.

