Figure 3.
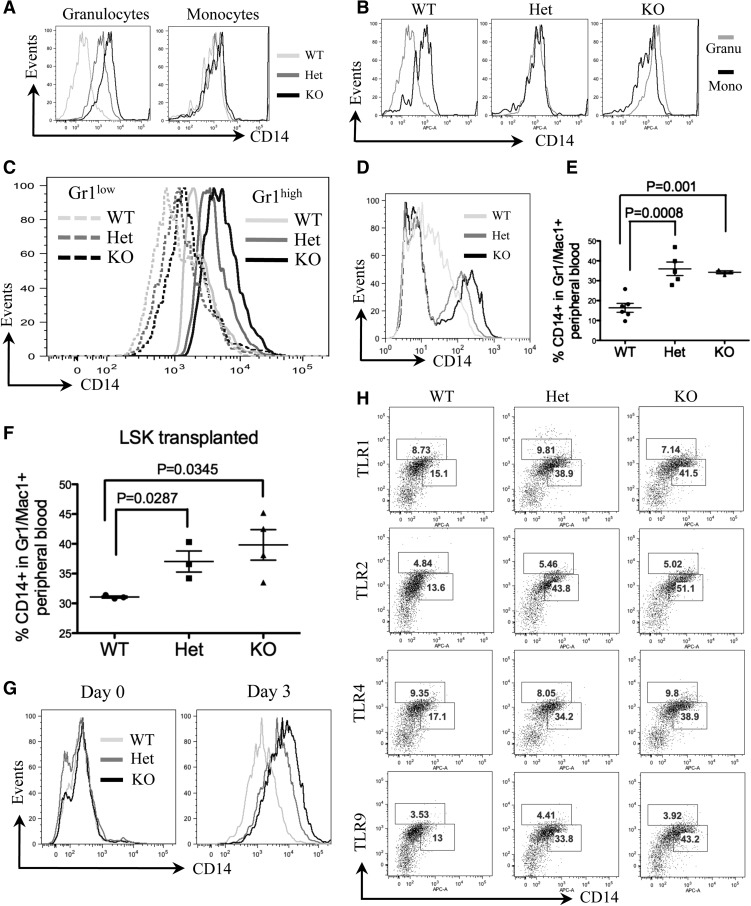
CD14 was aberrantly overexpressed on granulocytes of mDia1 heterozygous and knockout mice. (A) Flow cytometric analysis of CD14 expression in bone marrow granulocytes and monocytes of indicated mice. Data are representative of 3 independent experiments. (B) Flow cytometric analysis to compare CD14 levels in granulocytes vs monocytes of indicated mice. (C) Flow cytometric analysis of CD14 levels on the gated bone marrow Gr1low and Gr1high populations from indicated mice. (D) Flow cytometric analysis of CD14 levels on the gated Gr1 (Ly6G clone 1A8) positive peripheral blood granulocytes from indicated mice. (E) Same as Figure 2A. The percentages of CD14 positive cells in the peripheral blood Gr1/Mac1 double-positive granulocytes were analyzed. WT: N = 6, mean ± standard error of the mean (SEM) = 20.9 ± 2.02; Het: N = 5, mean ± SEM = 39.06 ± 3.25; KO: N = 3, mean ± SEM = 37.97 ± 0.52. (F) Same as Figure 2C. The percentages of CD14 positive cells in the peripheral blood Gr1/Mac1 double-positive granulocytes were analyzed. N = 3 in each group. WT: mean ± SEM = 31.07 ± 0.18; Het: mean ± SEM = 37.03 ± 1.75; KO: mean ± SEM = 39.83 ± 2.57. (G) Lineage negative bone marrow cells from indicated mice were purified and cultured in granulocyte differentiation medium for 3 days. The cells were harvested on day 0 and day 3 in culture for flow cytometric analysis of CD14. (H) Flow cytometric analysis of CD14 and indicated TLRs in peripheral blood Gr1/Mac1 double-positive cells of mice with indicated genotypes. The percentages of TLRs (upper gate) and CD14 (lower gate) positive cells are presented. Mice involved in this figure were all 6-8 weeks old.

