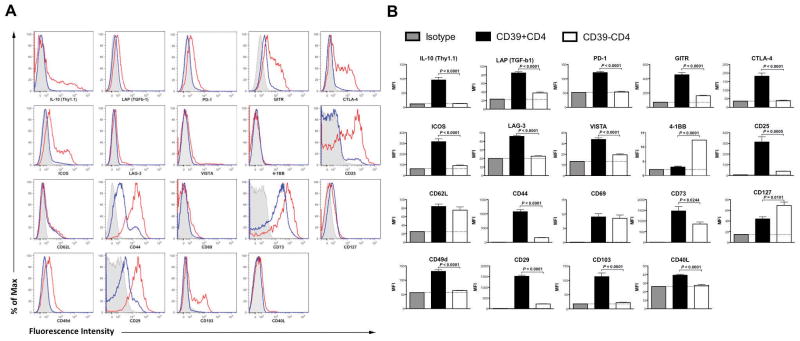
Figure 4.
Phenotyping cervical lymph node-sourced CD39+ versus CD39− CD4 T cells. CLNs were harvested from PSA-gavaged EAE-induced mice (day 18 post EAE induction). Total leukocytes were isolated and analyzed by flow cytometry. (A) CD39+ CD4 T cells display elevated regulatory signatures as compared to CD39−CD4 T cells. CD39+ and CD39− CD4 T cell populations were analyzed for the expression of each indicated marker. Depicted are the representative histograms for individual analysis from two independent experiments (n = 4–5, per group). Red line, CD39+CD4 T cells; blue line, CD39−CD4 T cells; grey shade, isotype. (B) For each analysis in (A), Mean ± SEM MFI values were quantified. Black, CD39+CD4 T cells; white, CD39−CD4 T cells; grey, corresponding isotype for each indicated marker. P value was calculated by two-tailed Student’s t test (n = 4–5 for each group).

