
Figure 3.
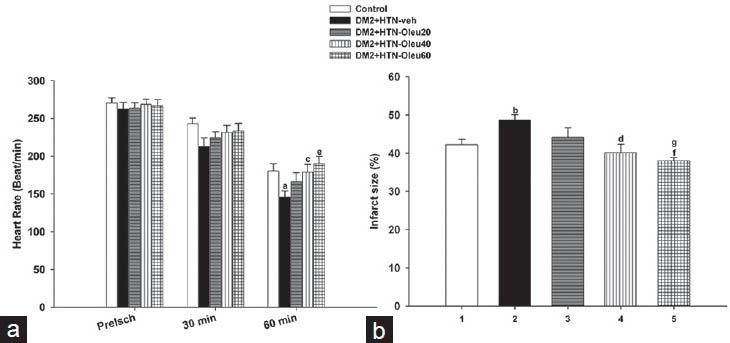
(a) Heart rate of control group (n = 8), simultaneous type 2 diabetes and renal hypertension group receiving vehicle (DM2 + HTN-Veh) (n = 8), and simultaneous type 2 diabetes and renal hypertension groups receiving oleuropein at 20 mg/kg/day (DM2 + HTN-Ole20) (n = 7), 40 mg/kg/day (DM2 + HTN-Ole40) (n = 6) or 60 mg/kg/day (DM2 + HTN-Ole60) (n = 8) at the preischemia (preisch), and at 30 and 60 min of reperfusion. (b) Myocardial infarct size (as percentage of left ventricle) of the same groups at the end of ischemia/reperfusion studies. Data are presented as mean ± SEM. Significant difference from the control (a; P = 0.02, b; P = 0.009). Significant difference from the DM2 + HTN-Veh (c; P = 0.03, d; P = 0.008, e; P = 0.005, f; P = 0.001). Significant difference from DM2 + HTN-Ole20 (g; P = 0.04)