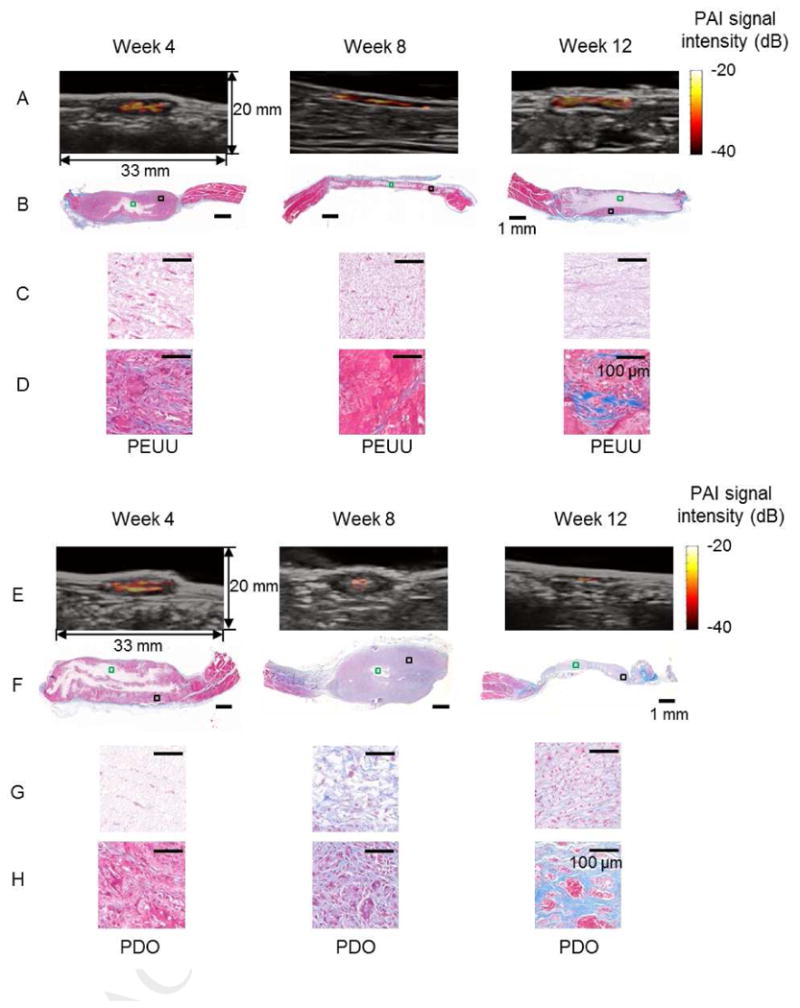
Fig. 6.

PAI of PEUU and PDO constructs. PAI maps and overlaid B-mode images for the PEUU (A) and PDO (E) constructs in the rat abdomen at weeks 4, 8 and 12. Masson's trichrome (MT) staining of PEUU (B) and PDO (F) constructs. Magnified images of representative areas (green box) in the central region of PEUU (C) and PDO (G) constructs. Magnified images of representative areas (black box) in the peripheral regions of PEUU (D) and PDO (H) constructs.
