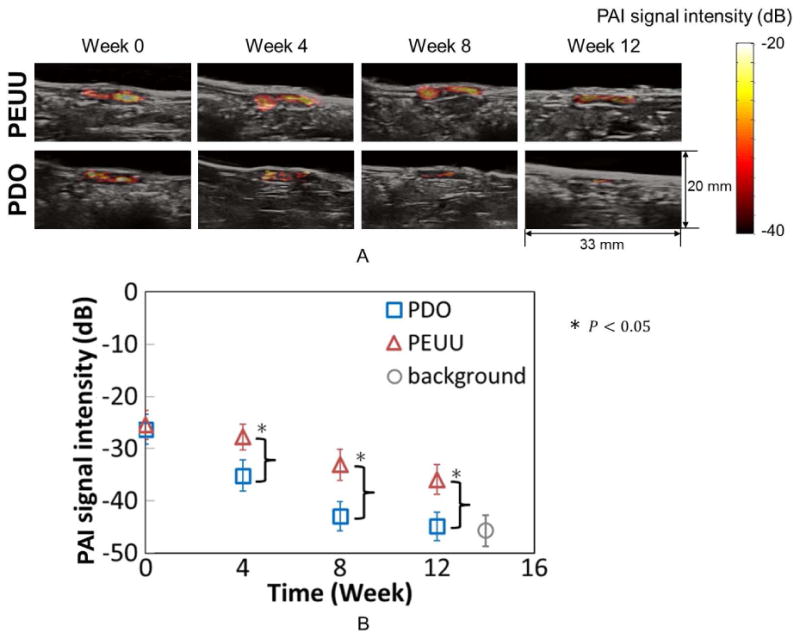
Fig. 7.

Longitudinal monitoring of structural changes of constructs by PAI. (A) PAI intensity map overlaid in the B-mode images for a rat implanted with PEUU (top panels) constructs and a rat implanted with PDO (bottom panels) constructs at weeks 0, 4, 8 and 12. Areas with high PAI signal intensity correspond to regions of remaining scaffolds with minimal tissue infiltration. (B) Average of PAI signal intensity of PEUU and PDO constructs at each time point. The background PAI signal intensity in Fig. 6B was obtained from the neighboring region to determine the baseline PAI signal intensity from tissues without scaffolds.
