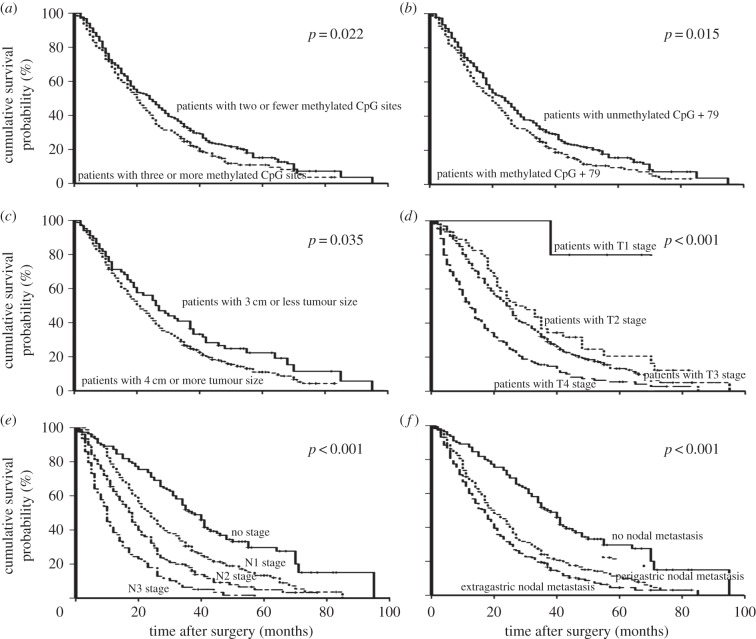
Figure 4.
Kaplan–Meier survival curves comparing months of survival in GC patients are shown for (a) methylated CpG site count of BCL6B promoter, (b) methylated status of CpG +79 of BCL6B promoter, (c) tumour size, (d) depth of tumour invasion (T stage), (e) number of metastatic lymph nodes and (f) location of lymph node metastasis.

