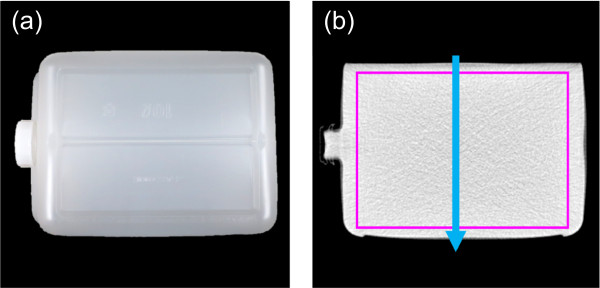
Figure 2.

The phantom used in the second experiment. Photograph (a) and CT image (b) of the polypropylene container. The purple rectangle and blue arrow in (b) illustrate the region of interest for attenuation measurements and position of attenuation profile measurements, respectively.
