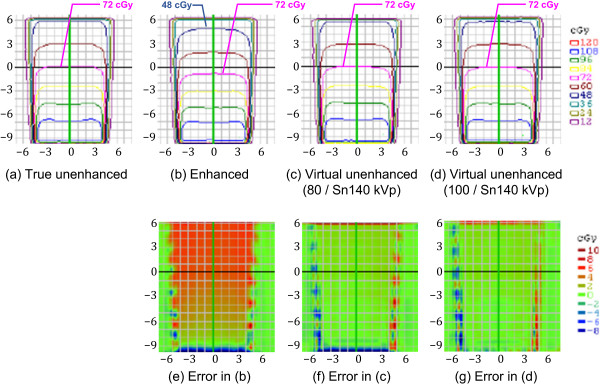
Figure 7.

Planar dose distributions and error maps (energy, 4 MV; field size, 10 × 10 cm2). Dose calculations were performed using (a) true unenhanced, (b) enhanced, (c) virtual unenhanced (80/Sn140-kVp), and (d) virtual unenhanced (100/Sn140-kVp) images. The three error (difference) maps correspond to (e) enhanced, (f) virtual unenhanced (80/Sn140-kVp), and (g) virtual unenhanced (100/Sn140-kVp) images, with the true unenhanced images as the reference. In addition to findings similar to those in Figure 6, more prominent dose errors are elicited using the enhanced images (e).
