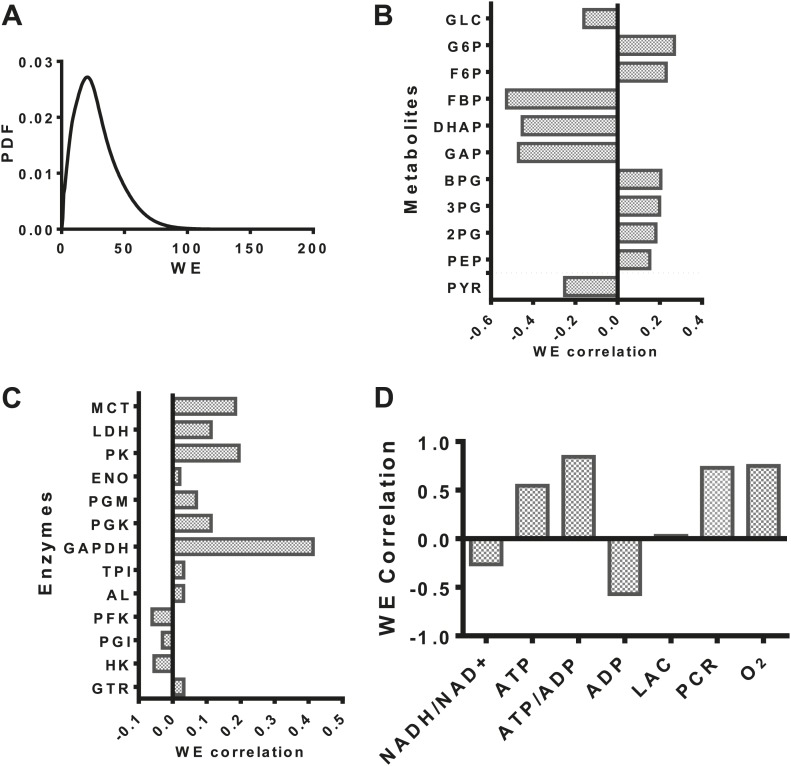
Figure 2. Evaluation of the statistics of the Warburg Effect and relationships to other variables in metabolism.
(A) Probability density function (PDF) of the Warburg Effect (WE) defined as the ratio of flux through LDH to that of flux into the mitochondria. (B) Pearson correlations of intermediate metabolite levels in glycolysis with the extent of the Warburg Effect (WE). (C) Pearson correlations of the expression levels of glycolytic enzymes with the extent of the Warburg Effect (WE). (D) Pearson correlations of coupled metabolic parameters with the extent of the Warburg Effect (WE).

