Figure 3.

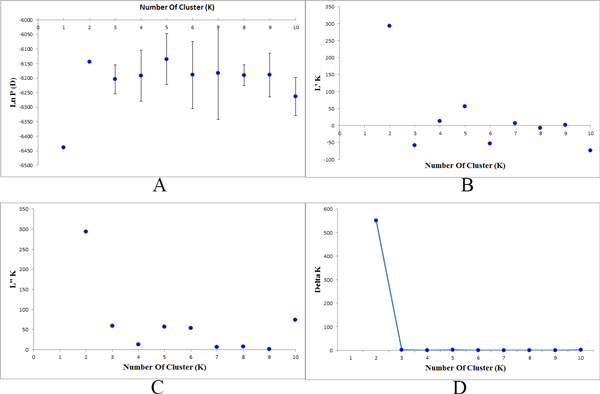
Identification of K. the method of delta K was used to identify the accurate sub-clusters in the population. In this population there is a peak of delta K in K = 2, the population is possibly composed of two sub-clusters.

Identification of K. the method of delta K was used to identify the accurate sub-clusters in the population. In this population there is a peak of delta K in K = 2, the population is possibly composed of two sub-clusters.