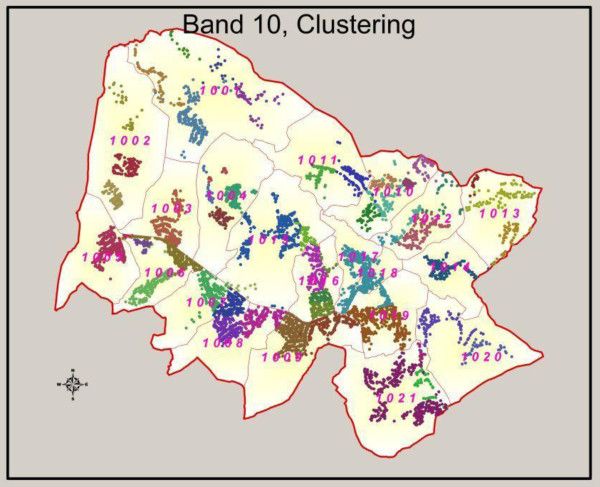
Figure 3.

Identification of cluster boundaries for randomisation. The figure illustrates the finalised cluster boundaries used for a particular band within the study area. GPS points, local knowledge and GIS were used to identify approximate clusters. This was achieved by plotting all surveyed household within a certain area onto Google Earth. Using this as a tool alongside local knowledge, we would roughly draw cluster boundaries using the polygon drawing functionality in Google Earth. These rough boundaries were then translated into finalised cluster boundaries using ArcGIS.
