
Figure 2.
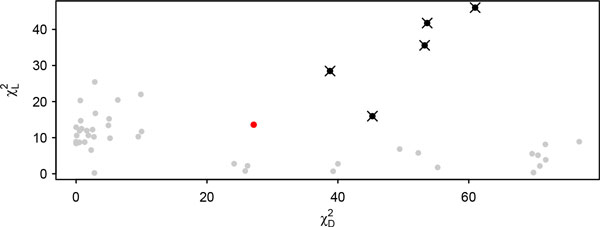
Bivariate plot of the two test statistics and . Those points corresponding to markers identified as significant under the Holm correction are in black dots. Those identified significant by the standard Bonferroni correction are marked with an ×. The red dot is the marker that is newly detected by the Holm correction. All other (non-significant) empirical joint test statistic points for multiple PCs and multiple markers are plotted in gray.