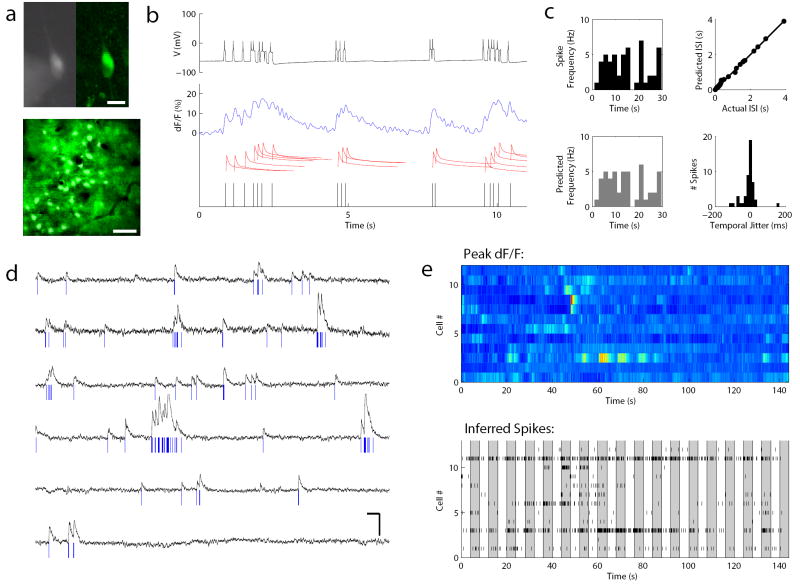
Figure 5. Direct methods for validation of optical signals as action potentials.
A. Image of a cortical cell in an acute slice, filled with Oregon Green BAPTA-1, under simultaneous whole cell patch clamp and 2P imaging, using first CCD imaging (left) and then 2P imaging (right, bottom). Scale bar, top: 25 um, bottom: 100 μm. B. Methodology for quantifying accuracy of deconvolution. Top, black: visually evoked spike trains were recorded in vivo and then replayed to the imaged cell via the carefully calibrated injection of current at specific spike times. This resulted in patterns of action potentials that were also recorded electrophysiologically. Middle, blue: Simultaneous targeted fast-scan two-photon imaging during the evoked spike train enabled the optical capture of the cell’s complex response. Middle, red: A “peeling” deconvolution algorithm22 was applied to these waveforms to decompose the signal into single-spike waveform events that we assume sum linearly at moderate frequencies. Bottom, black: Each single-spike event is then attributed to a spike time, and the “optically resolved spike times” are compared to the actual spike times for accuracy in the algorithm’s estimation. C. Comparison of the distribution of spike times recorded (top left) vs. predicted from the optical signal (bottom left) to assess the accuracy in identifying and resolving spikes (96% inter-spike intervals [ISI] bins correctly placed). The actual and predicted ISI are also compared (top right, mean deviation between individual ISI = 0.012 s). Finally, the temporal fidelity (predicted vs. true time in ms) was quantified (bottom right), showing that our optical prediction algorithm was adept at identifying the spikes and their locations with tight temporal accuracy (mean jitter between actual and predicted spike time = 8 ms). D. Implementing this algorithm in vivo allows us to resolve optical spike trains from populations of neurons simultaneously. Shown are traces from 6 different neurons. Scale bars: 5 s, 15 dF/F %. E. These spike trains could be visualized either by projecting the dF/F signal into color space (top) or by plotting the spike trains in space (bottom). Each shaded bar represents the time of presentation (4 secs) of a drifting visual grating of one orientation. The two depictions (top and bottom) are reasonably well-matched, providing another way to diagnose and troubleshoot the accuracy of deconvolution methods.

