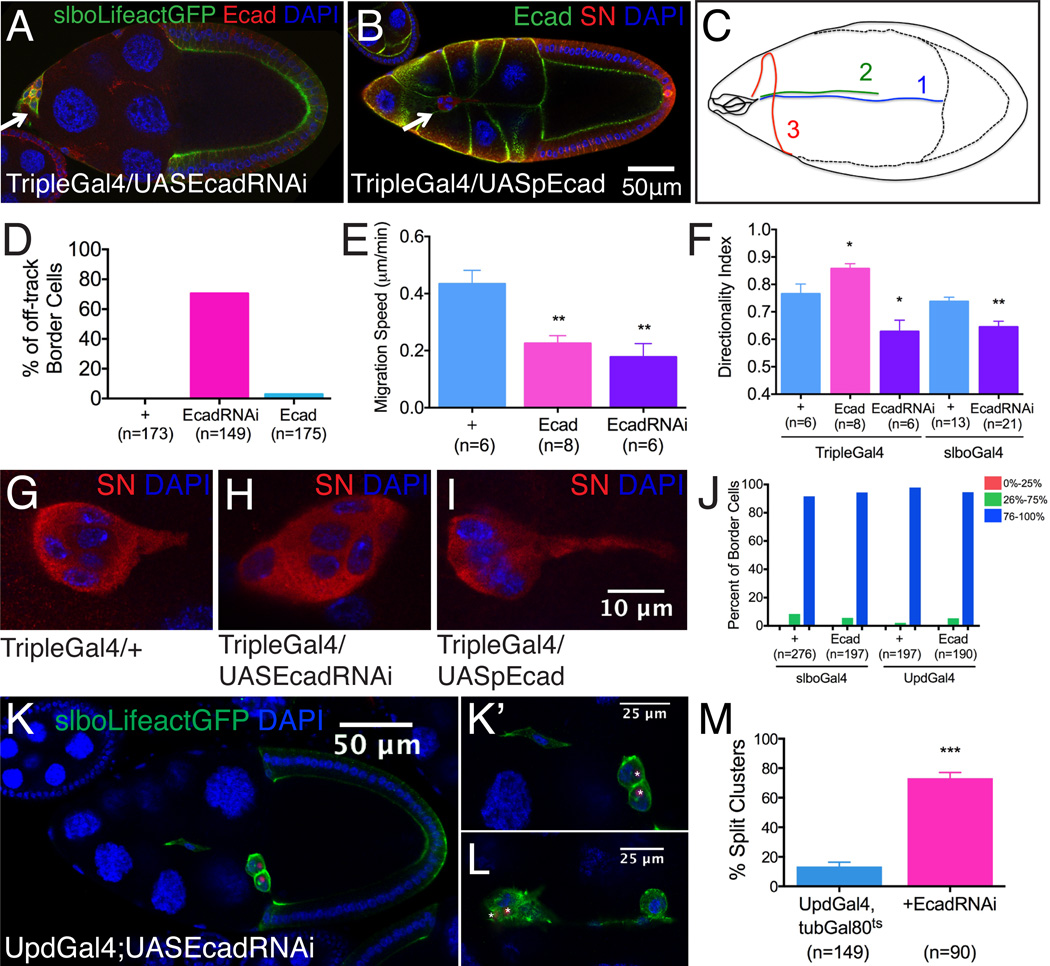
Figure 2. Effects of germline and polar cell E-cadherin RNAi or over-expression on border cell migration.
(A-B) Distribution of E-cadherin in stage 10 egg chambers following nurse cell-specific Ecad RNAi (A) or overexpression (B). Border cell cluster positions are marked by arrows. (C) Diagram showing representative migration paths of 1.WT; 2.TripleGal4, UASpEcad; 3.TripleGal4, EcadRNAi border cells. (D-F) Quantification of migration phenotypes. *p<0.05; **p<0.005. Data are presented as mean ± SEM. (G-I) Magnified views of border cell clusters of the indicated genotypes showing the effects of inhibition (H) or over-expression (I) of E-cadherin in the germline on border cell protrusion. (J) Quantification of border cell migration at stage 10 with or without full length E-cadherin overexpression in border cells using slboGal4 or polar cells using UpdGal4. (K-M) Stage 10 egg chambers expressing EcadRNAi in polar cells (K) and higher magnification view (K’). (L) A second example. Border cell clusters are marked by slboLifeactGFP. Polar cells express nuclear dsRed. (M) Quantification of split clusters in UpdGal4, tubGal80ts with or without UASEcadRNAi. ***p<0.001. Data are presented as mean ± SEM.

