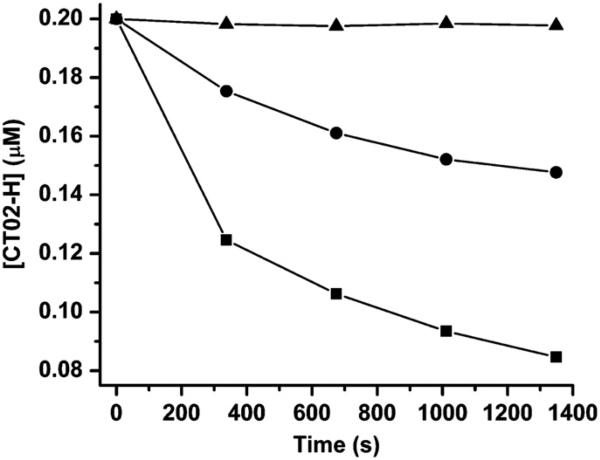
Fig. 10.
Cellular generation of detected by CT02-H. The generation was stimulated by adding menadione (100 μM) to the cell suspension (3.8 × 10⁵ (■) or 1.2 × 10⁵ (●) cells/ml in a 40-μl EPR capillary tube) containing CT02-H (0.2 μM) and DTPA (100 μM) in DMEM. EPR spectra were recorded 5 min after the addition of menadione. SOD (200 U/ml) (△) was used to verify the generation. The concentration of CT02-H was quantitated by comparing the double integral of the EPR signal of each radical with its predetermined concentration (i.e., 0.2 μM).

