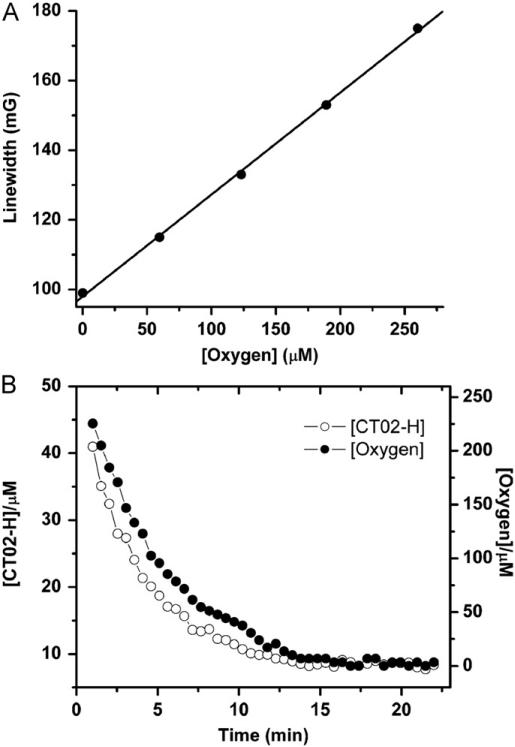
Fig. 12.
(A) Variations in the EPR linewidth of the low-field peak of CT02-H with O2 concentration. (B) Simultaneous monitoring of O2 and TAM concentrations by EPR in the system containing CT02-H (100 μM), X (100 μM), XO (10 mU/ml), and DTPA (100 mM). The concentration of CT02-H was quantitated by comparing the double integral of the EPR signal of each radical with its predetermined concentration (i.e., 100 μM).

