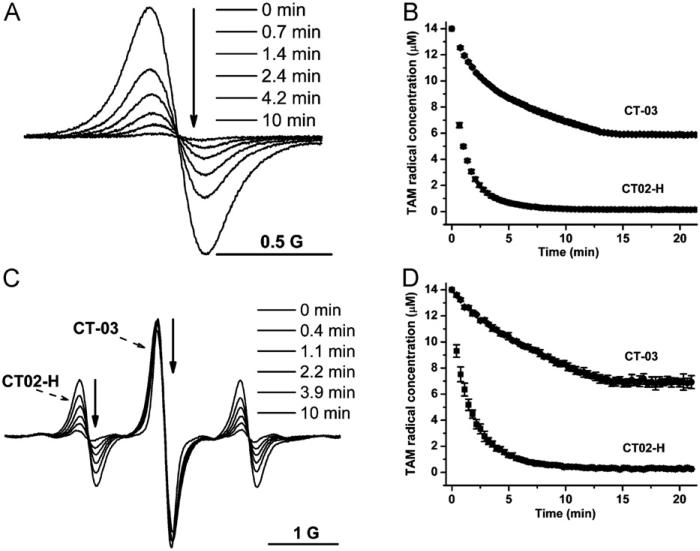
Fig. 2.
(A) -induced decay of the low-field peak in the EPR signal of CT02-H. XO (0.01 U/ml) was added to the solution containing CT02-H (14 μM), DTPA (100 μM), and X (100 μM) in PBS (pH 7.4) and EPR spectra were recorded over time. (B) Plot of TAM radical concentration as a function of time. Error bars are small and within the symbols. (C) Simultaneous measurement of EPR signal decays in both CT02-H and CT-03 after addition of XO (0.01 U/ml) into the solution containing CT02-H (14 μM), CT-03 (14 μM), DTPA (100 μM), and X (100 μM) in PBS (pH 7.4). (D) Plot of TAM radical concentration as a function of time according to the data in (C). TAM radical concentration was quantitated by comparing the double integral of the EPR signal of each radical with its predetermined concentration (i.e., 14 μM). All the experiments were repeated three times.

