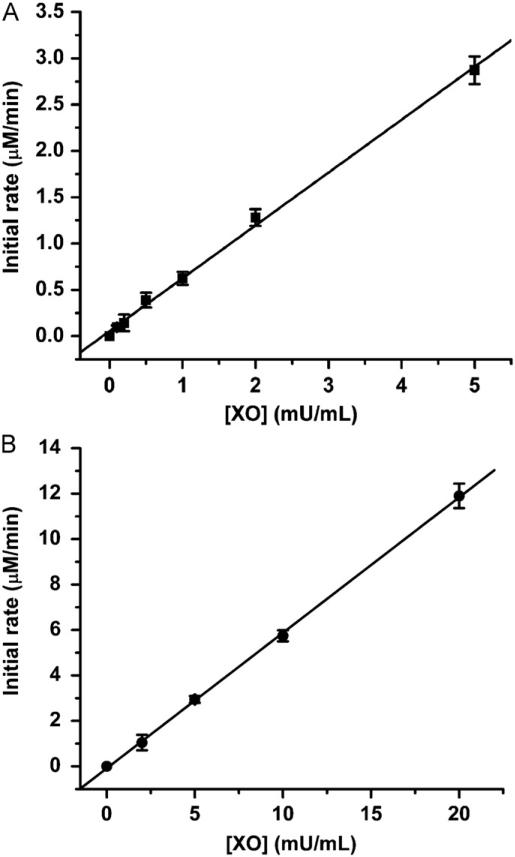
Fig. 8.
(A) Detection of various fluxes by EPR using CT02-H. The incubation mixture contained X (100 μM), DTPA (100 μM), CT02-H (50 μM) in PBS (pH 7.4) at room temperature. Various concentrations of XO (0.1, 0.2, 0.5, 1, 2, and 5 mU/ml) were added to initiate the reaction. The decay rate of CT02-H, that is, the generation rate, was determined to be 0.56±0.02 μmol/min/U. (B) Detection of various fluxes by UV–Vis spectroscopy using ferricytochrome c. The incubation mixture contained X (100 μM), cytochrome c (100 μM), EDTA (100 μM), and catalase (200 U/ml) in PBS (pH 7.4) at room temperature. Various concentrations of XO (2, 5, 10, and 20 mU/ml) were added to initiate the reaction. The generation rate was determined to be 0.58±0.02 mmol/min/U. See details under Materials and methods.

