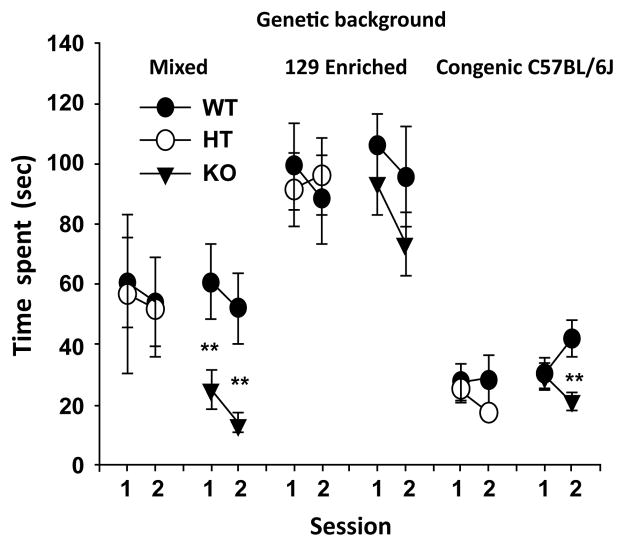
Figure 3.
Impact of genetic background on active social interaction in Sept5 deficient mice. Interaction time (mean ± SEM) spent in active social interaction between mice is shown in two successive 5-min sessions. Asterisks indicate statistically significant differences from WT mice at 1% (**) levels, as determined by Newman-Keuls comparisions. This figure is reproduced from [108,109] with permission of the Oxford Press.

