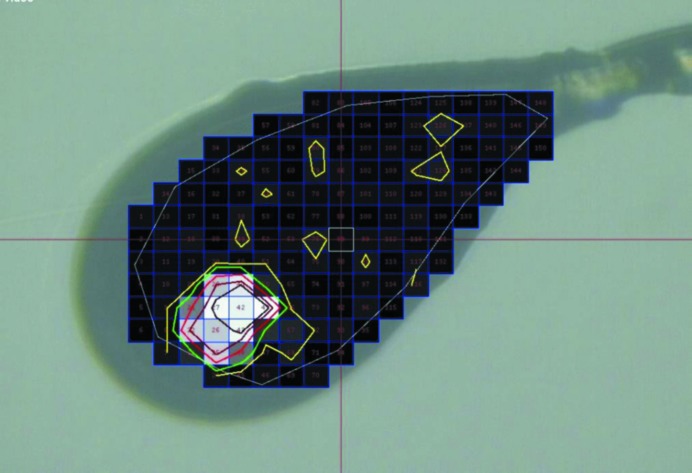
Figure 12.
An example of a crystal image with X-ray rastering information overlaid to accurately define the crystal position within the loop. By repeating the process in a perpendicular direction the precise three-dimensional position of the crystal and the strongest diffracting area is obtained. For scale, in this case each rastered pixel is 20 × 20 µm.

