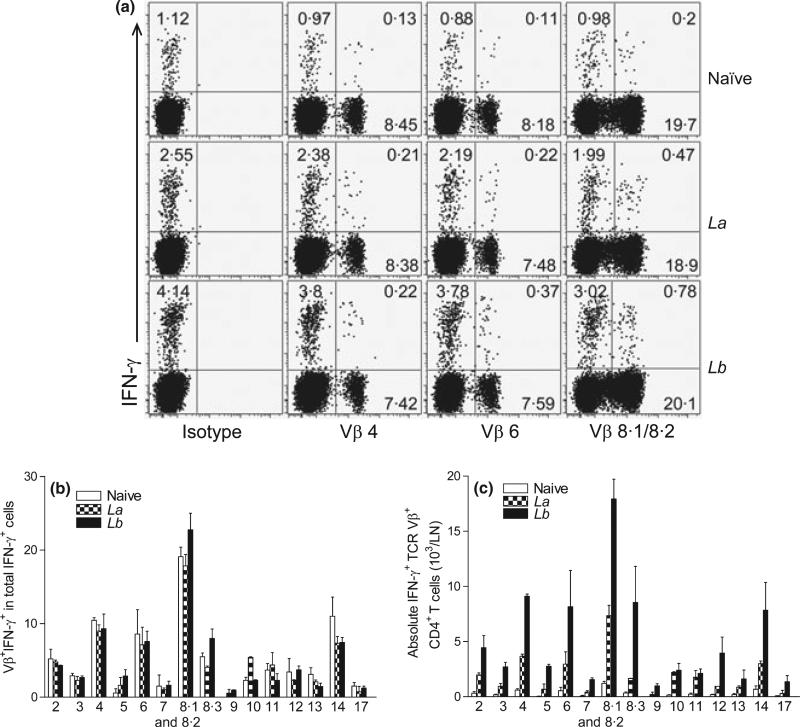
Figure 2.
The percentages of IFN-γ production in TCR Vβ+ CD4+ T cells derived from draining LN. C57BL/6 mice (five per group) were infected with 2 × 10⁶ La or Lb promastigotes for 4 weeks, and draining LN cells were collected and pooled into two sample sets. After a brief (6 h) treatment with PMA/ionomycin/GolgiPlug, intracellular IFN-γ production from CD4+ TCR Vβ+ T cells was analysed together with Vβ TCR screening panel by FACS. (a) Shown are the percentages of IFN-γ-producing Vβ4, Vβ6 and Vβ8.1/8.2 cells, respectively. Data are representative results from four repeats with similar trends. (b) Shown are the ratios/percentages of IFN-γ-producing TCR Vβ among total IFN-γ+ CD4+ T cells. (c) Shown are the absolute numbers of IFN-γ-producing Vβ+ CD4+ T cells per LN. The results are shown as mean ± SD (pooled from these four sets of results from two independent repeats), and the bars represent the maximum and minimum values.

