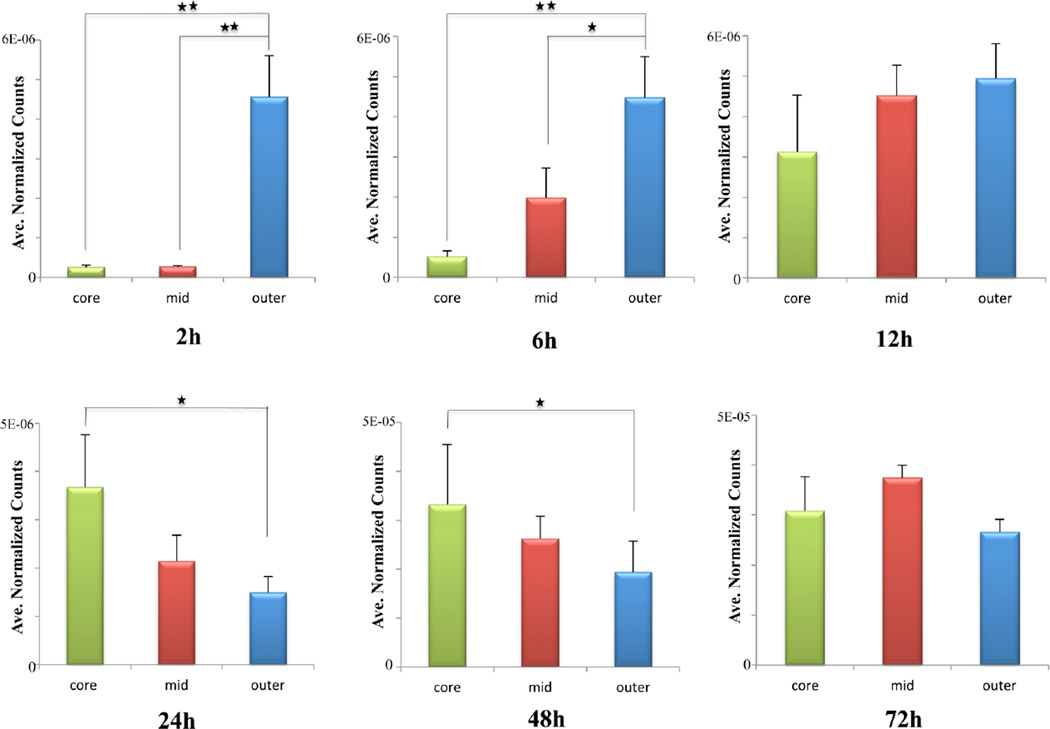
Figure 3.
Relative quantification of irinotecan levels in three regions (core, mid, outer) of dosed spheroids. Data was processed and normalized by using MATLAB. Spectra were extracted from different regions of interest and irinotecan signal intensity was then averaged. Error bars stands for the standard error for measurements of three sections from a single dosed spheroid at each time point. *p < 0.05, **p < 0.01.

