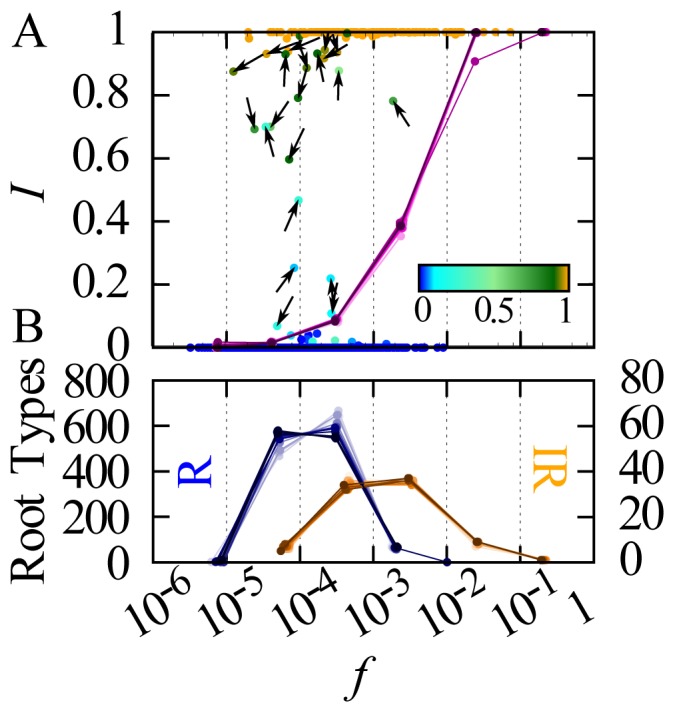
Figure 2. Relationship between frequency  and regularity in the core vocabulary.

Lighter saturation of a color indicates earlier decades, while darker saturation indicates later decades. (A) Single points represent roots in the final decade (1980–1989), color-coded according to the average value of  across all 16 decades. Arrows are placed on 21 active verbs with
  . The direction of each arrow indicates the trajectory from the first to the last defined occurrence in the (
 ) space; the length of arrows is fixed. The purple curves show the binning of both
  and
and  in each frequency logarithmic bin, for each decade. (B) Distributions of the number of stable regular roots (left axis) and stable irregular roots (right axis) for each decade, showing separate peaks which indicate different frequency profiles.
